


Gold and silver seasonality: We are entering the “golden period”
To put it bluntly we are now entering the crunch time period for gold and silver gains, especially silver. The latest repeat of the “beginning of the year seasonality rally” was last seen exactly a year ago, when both metals ripped higher at the beginning of 2016. Being more weighted towards silver than gold during the months of January as well as February seems prudent in light of the historic patterns presented in the charts below. Silver gained about 6% on average from January 1 to the end of February, while Gold averaged a return of close to 3% during the same period.
- Silver seasonality pattern
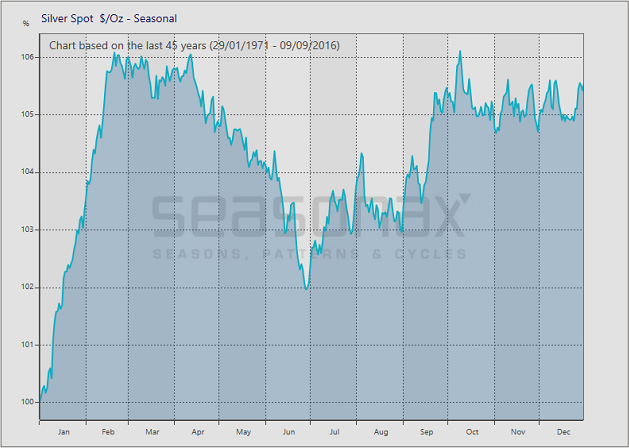
Silver seasonality pattern based on 45 years of data (1971-2016).
- Gold seasonality pattern
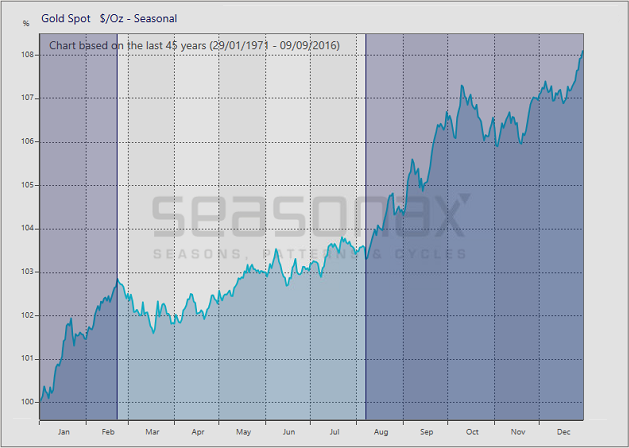
Gold seasonality pattern based on 45 years of data (1971-2016).
As always with the markets, a nice rally is definitely NOT a “sure thing”. Given the continued strength in the dollar, gold and silver has held up relatively well though, by not making lower lows when the dollar has been reaching new highs. Relative strength is also showing up in the “leveraged play” on the metals, namely the mining stocks. The gold and silver miners saw reduced momentum in their decline while gold and silver were making new lows in December.
To sum up: Gold and silver are entering a historically strong period while showing strength vs the dollar on top of the miners showing strength vs the underlying metals. Personally I am investing in the mining stocks because of leverage, relative strength as well as attractive valuations at this point in time. Remember to always have a Stop Loss in play since this is the most volatile market there is in the investment space.