


Chart of the day: GDX
GDX (gold producers) is looking quite bullish on the weekly chart for at least a swing higher in the short/medium term:
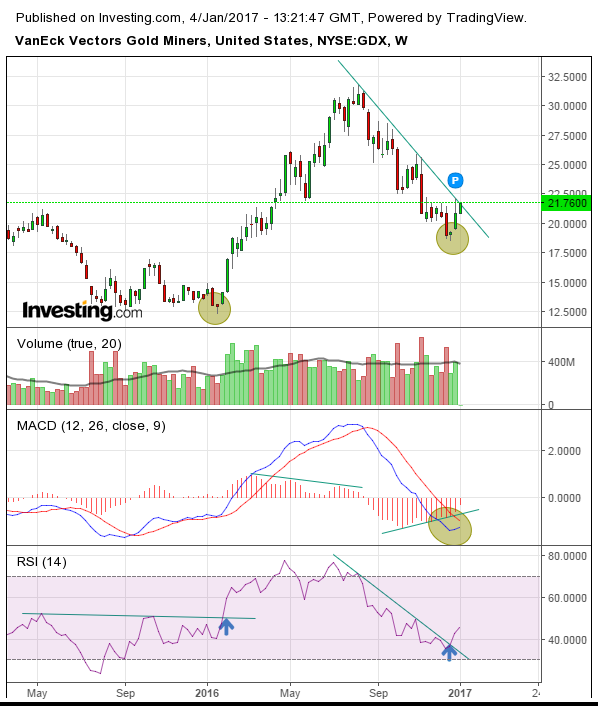
GDX – Weekly chart.
- MACD has turned up.
- Histogram shows correction lost strength.
- Weekly candle stick hammer (Last seen at the end of the last major bottom).
- RSI turning up and breaking down-sloping trend ceiling.
Still early in the game and I would like to see GDX close higher than last week and at the same time break the over head trend line resistance for a real show of strength.