


Charts of The Day: Revisiting NVO & IRV
As I stated in yesterday’s “Charts of the Day”, both Novo and Irving looked fragile in the short term. Well, within 24 hours both had corrected a lot. All the way down to levels which I thought were too good pass on, thus I started adding to my position in both, aggressively so. The following slides will cover why I consider both to have arrived at very interesting cross roads. I am very bullish on both in the long term and I often add to my core position when I think there is an opportunity for a decent trade if at least. Basically, there are levels (valuations) where I get much more aggressive and refuse to sell below from a fundamental stand point. If the chart looks promising as well, I might get very very concentrated in certain stocks, at least until the SP reflects a more “fair” valuation in my eyes. In other words; I am willing to hold a lot of shares in a company that I think is fundamentally undervalued on top of being at an interesting cross road after a big flush out. Given that I think both will go up in value in the long term I am not that worried about permanent losses given the currently known information.
(Keep in mind that I am no TA “expert” and that you should always do your own due diligence)
Anyway, here is what I see in Irving:
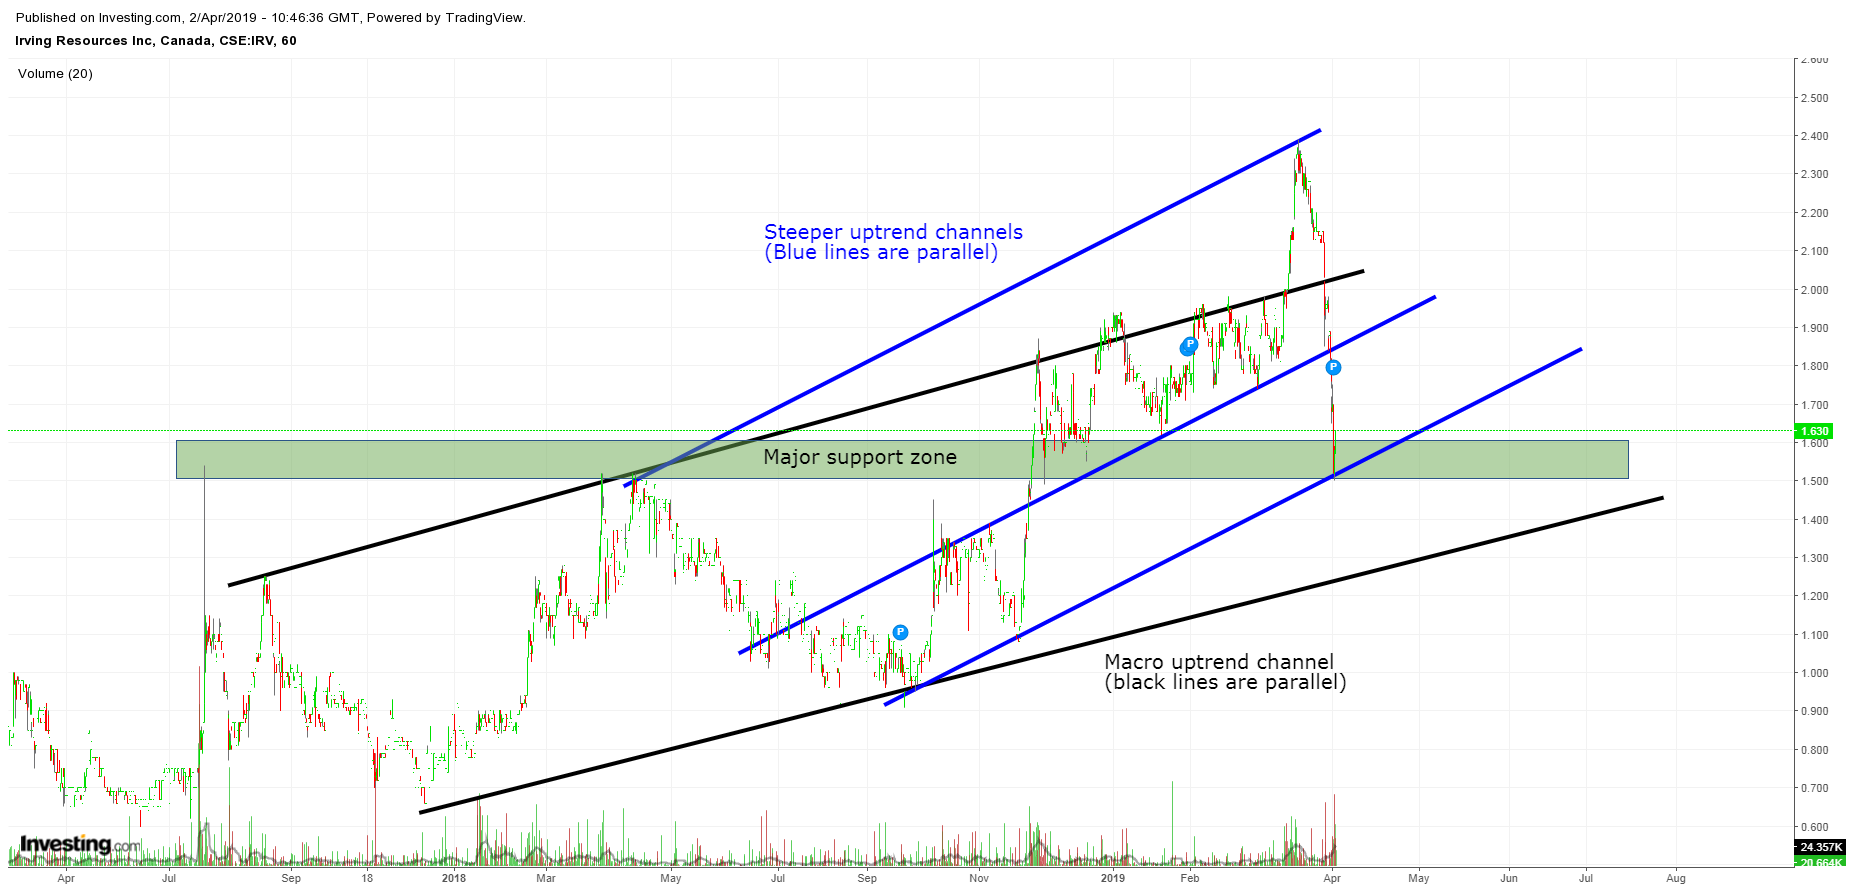
Irving Resources (Daily).
… As you can see, Irving broke out of the long term bull channel (black), then proceeded to hit a point which coincides with an even steeper bull channel (blue), before rebounding hard in the aftermath of the Miramont fallout. Now, given that I; a) Think that nothing really changed for Irving from a fundamental stand point I see it as an opportunity to pick up cheaper shares, all else equal, and b) Irving has reached a point where I think the bankable to “semi bankable” assets make up a lot of the current MCAP, regardless of what comes out of the high impact Omu Sinter drilling results that ought to be out next month (Reasoning explained HERE). Furthermore, the share price has arrived at probably the most solid support zone in that graph. The “major support zone” seen in the slide above goes back to 2017 and has proven to be both major resistance as well as major support, a number of times.
The slide below is also an interesting one:
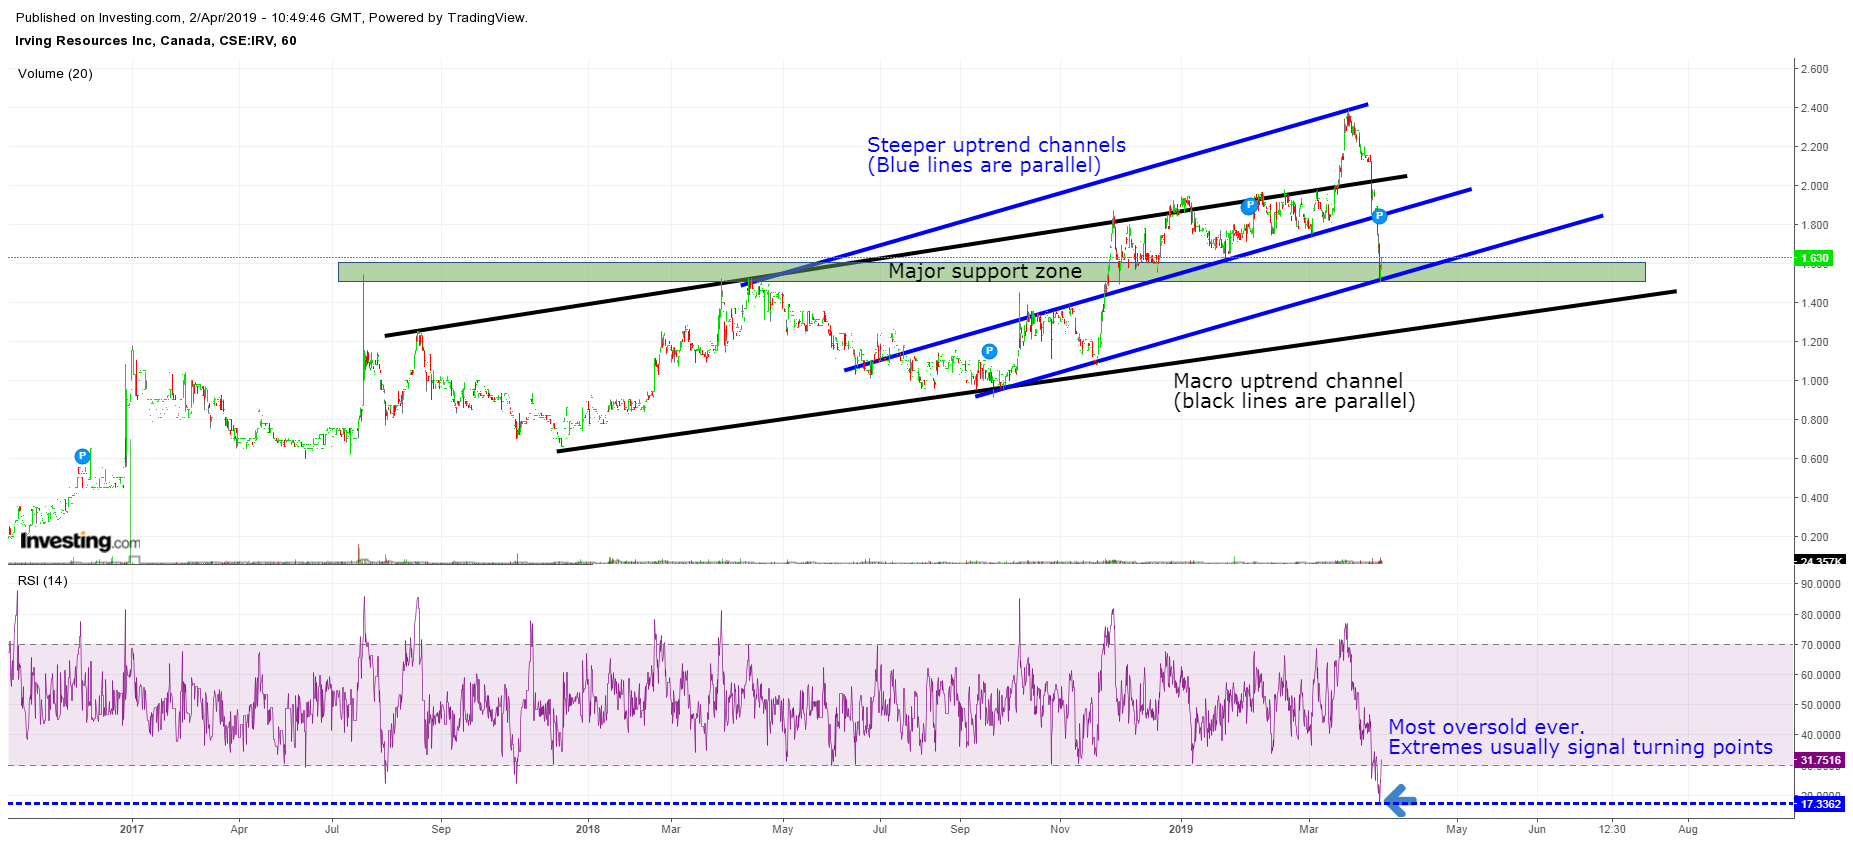
Irving Resources (Daily).
… As you can see, the RSI reading is at its lowest point, ever. In other words, never before has shares of Irving been as oversold as now on a daily basis. As you can also see, extreme RSI readings have often proved to signal a turning point in the share price. Given the charts and the reasoning I have laid out above, coupled with my fundamental view of the company, I have personally been buying aggressively lately.
Now, lets look at Novo resources:
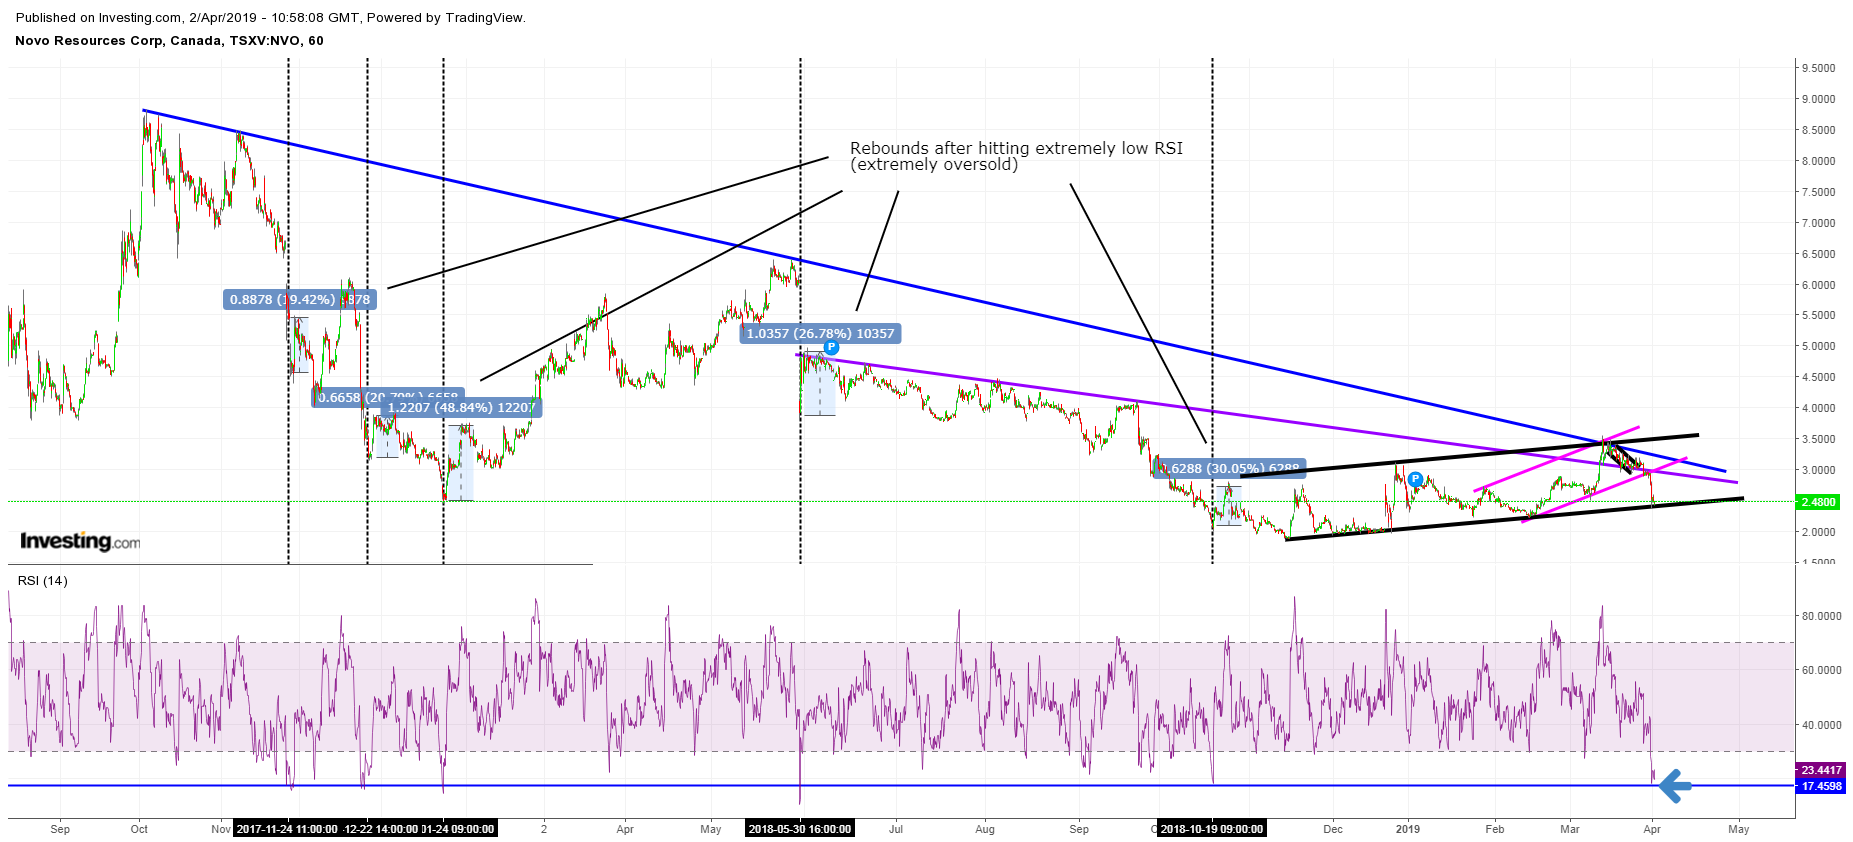
Novo Resources (Daily).
… As you can see above, Novo continued to fall after yesterday’s NR, after already having been slammed by the Miramont fall out. In fact, it has corrected 20% in the last three days and that represents more than C$100 M of Novo’s market cap being shaved off. Also note that even in the major bear trend since 2017, extremely low RSI readings produced some serious rebounds if nothing else, every time.
Was the new resource estimate a disappointment? Sure, I had hoped for 1.1-1.2 Moz in total resources. But with that said, we are still only talking about the very first, near surface, edge of a system that is wide open. The current resource more or less only covers the mineralization that could be included in an open pit scenario. There is plenty more gold down dip from the fault, with already known intercepts of up to 3m of 20 gpt.. Was a negative reaction justifiable? Sure, the market obviously had higher expectations, but again, the BC open pit resource is just the tip of the ice berg at BC. Furthermore, BC is just the tip of Novo’s total ice berg since I believe we will find many more BC systems in the Hardey Formation with time (Not to mention Mt Roe, Egina, the source(?), lode gold and potentially younger and even older conglomerates).
More importantly Novo’s weekly chart looks much more encouraging:
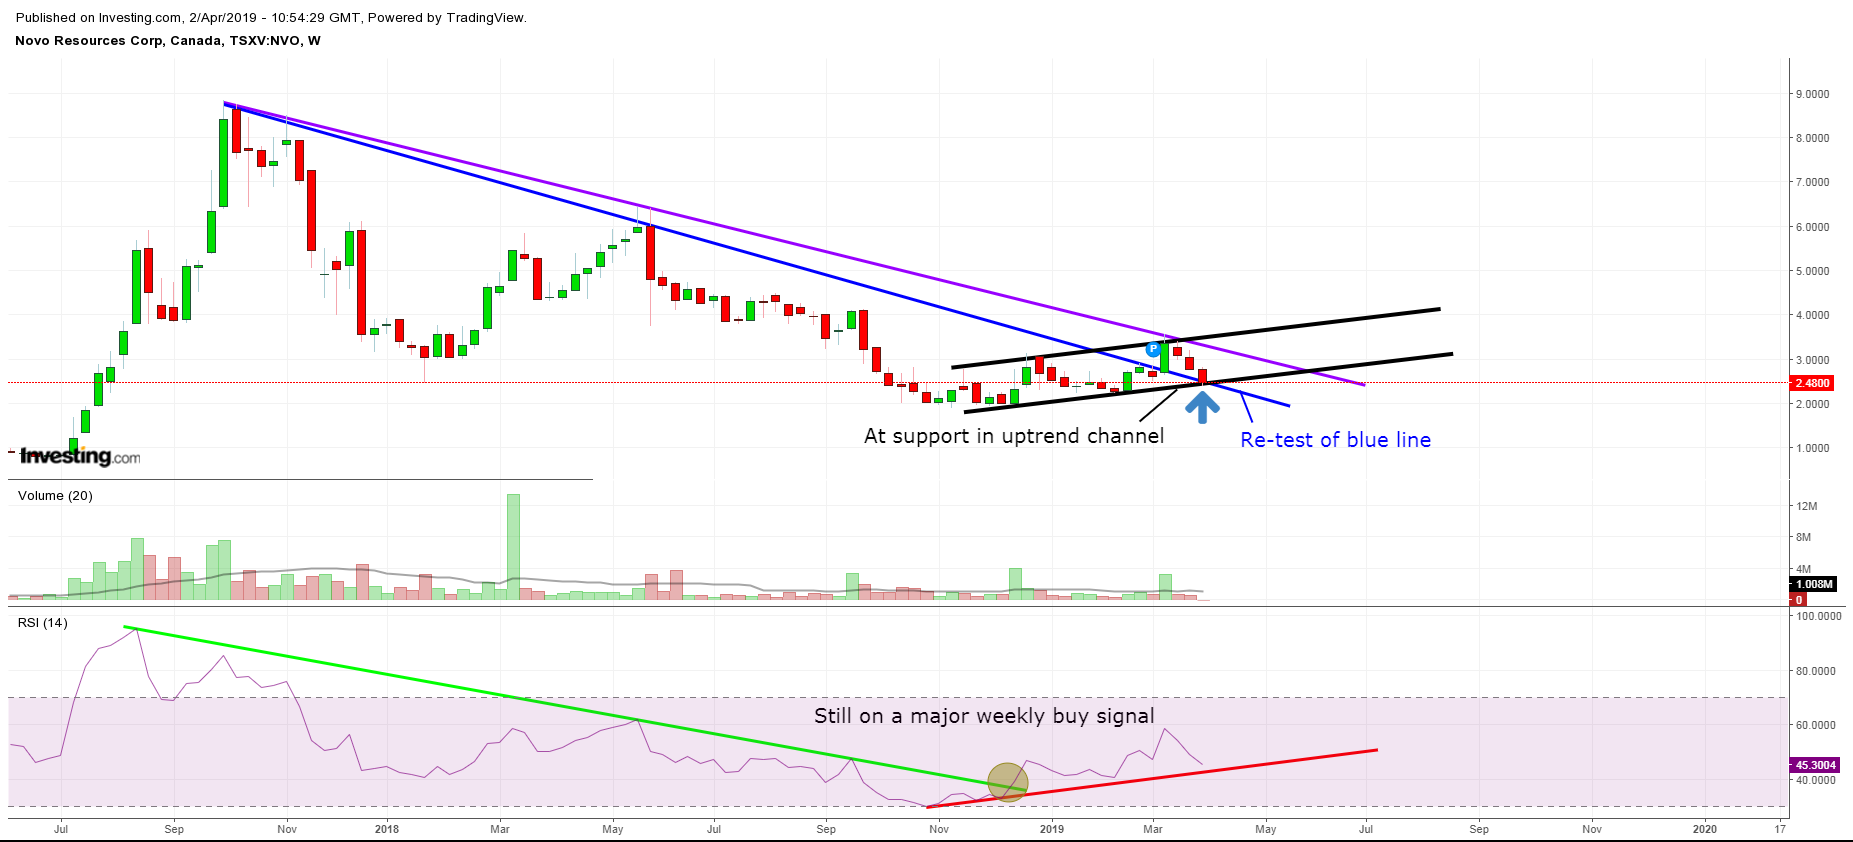
Novo Resources (Weekly)
… As you can see, the Novo share price is near two weekly trend lines that could provide support. One is the black bull channel support line and the other is the re-test of the blue line which Novo broke out of a few weeks back. Not only that, but Novo made major bull break on the weekly RSI late last year, and that buy signal is so far intact. Thus we currently have at least three positives on the weekly chart: Two support lines and we are still on a major weekly RSI buy signal. Remember, these are still no guarantees that we won’t go lower, but rather favorable signs that we may not. I personally don’t mind it going either way since I hope I will be able to shed some shares from other gainers to take advantage of the cheaper Novo shares. My goal is still pretty basic: I want as much shares of Novo as I can before Novo hopefully surprises people with the lowest cost gold production in possibly the world. Same basically goes for Irving, and the positive side of Miramont’s dusters was that it seemed to have brought both Novo and Irving down with the. Big loss in one… Able to buy more and cheaper shares in the other ones.
Lastly, on a micro scale, we have some bullish divergence on the Hourly chart:

Novo Resources (Hourly).
… Not a big deal perhaps, but a positive none the less (at least for longs who are already have their targeted allocation). I will probably start working on a post today that covers why Beaton’s Creek is probably much more valuable than what is reflected in Novo’s Enterprise Value which currently sits at around US$257 M. Remember, Novo’s Enterprise Value is supposed to reflect the total Expected Value out of all Novo’s current projects as well as a the Expected Value out of 12,000 km2 of untouched exploration potential. Anyway, I have begun to make some slides at least and here is a sneak peek of open pit comparables:
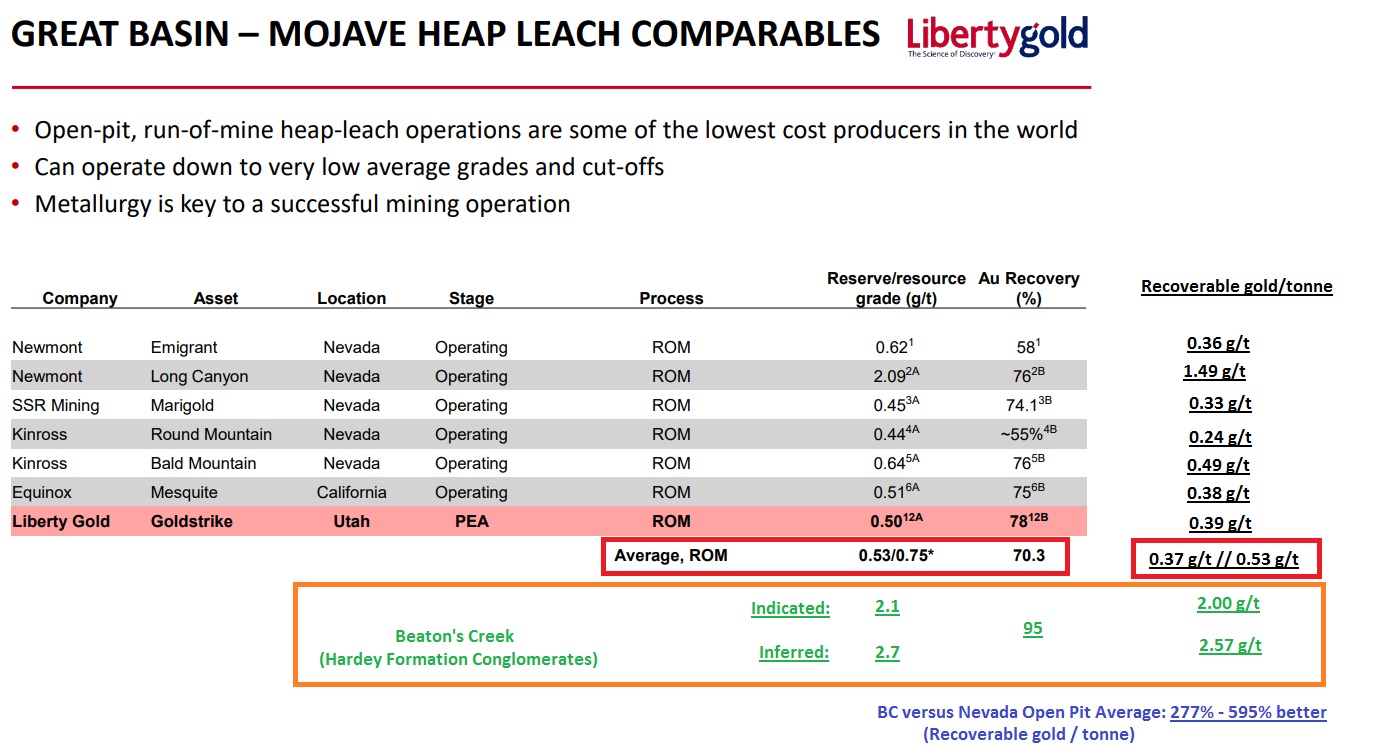
Open pit comparables, Nevada operations and Beaton’s Creek (Hardey Formation). Source: Libertygold and Horseman.
(Note: I own all shares mentioned in this article and might buy and sell shares at any point in time. This is not investment advice. Mining stocks are very risky and can be very volatile. Always do your own due diligence and make your own decisions..)
Best regards,
The Hedgeless Horseman
Follow me on twitter: https://twitter.com/Comm_Invest
Follow me on CEO.ca: https://ceo.ca/@hhorseman
Don’t forget to sign up for my Newsletter (top right on front page) in order to get notification when a new post is up!