


Charts of The Day: Oil, Copper, Gold & Silver
Just to get a sense of what the situation is for the commodity market overall in the medium to long term I put together a few charts that can be seen below. These all suggest to me that we indeed are in a raging commodity bull market, but that gold and silver are just lagging behind a bit. Note that I forgot to draw a few lines here and there, but if I draw them all, the charts would get messy really quick.
Brent oil:
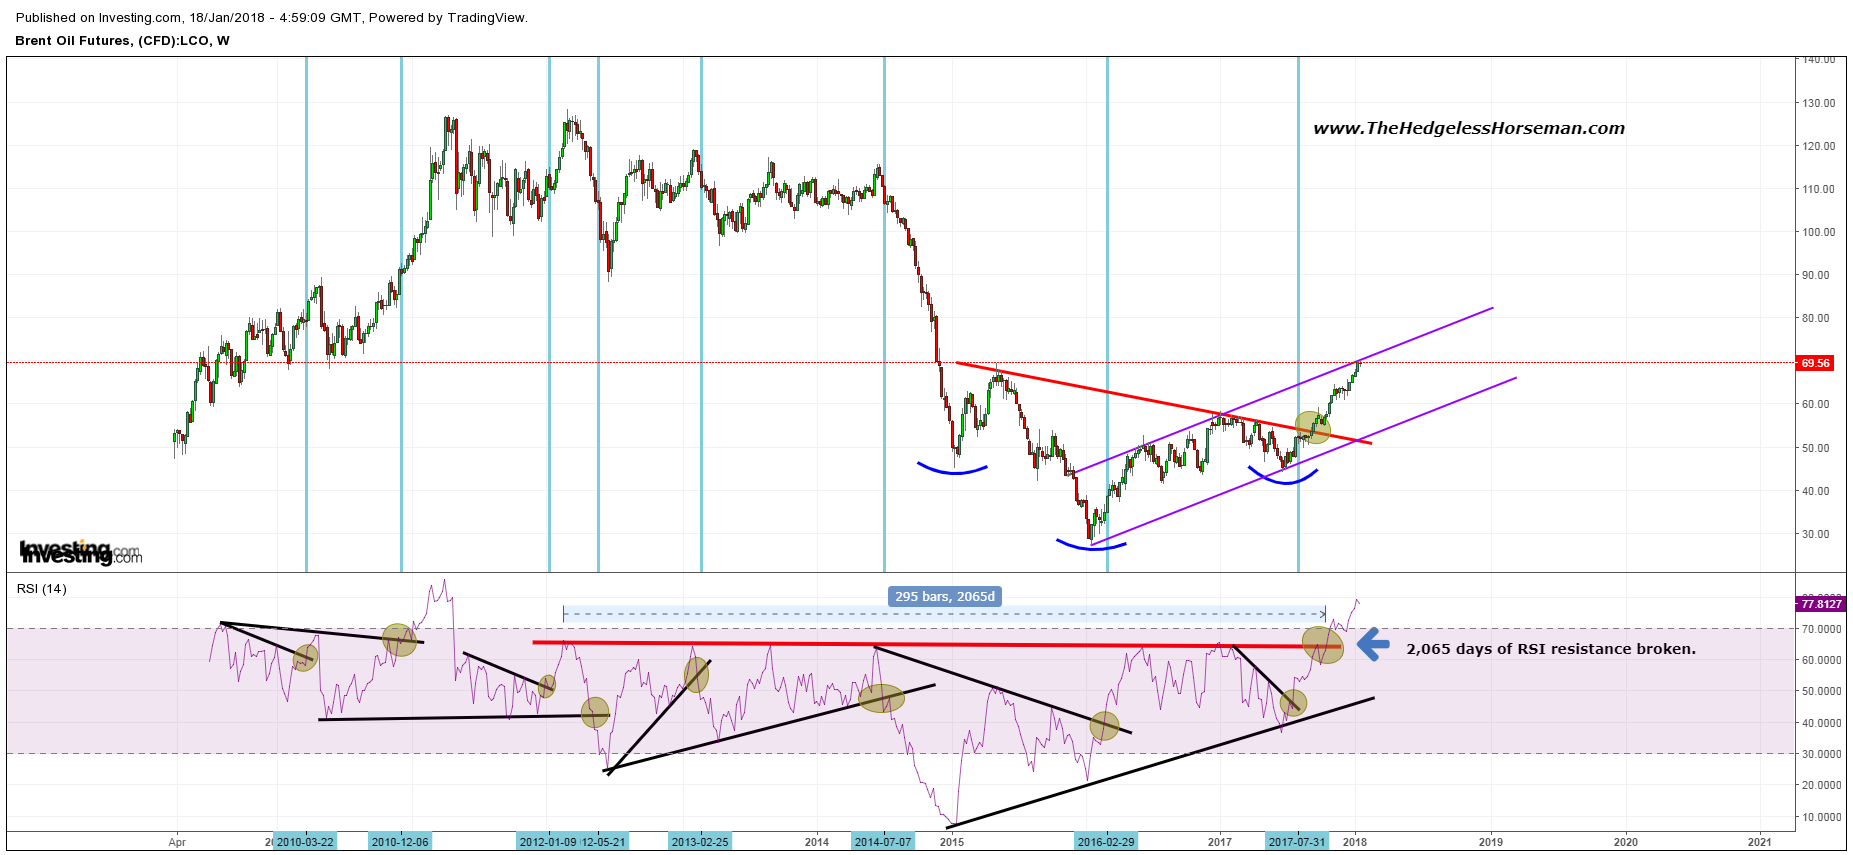
Brent oil (Weekly).
I would just point out the fact that Brent oil has broken out of a reverse head-and-shoulders pattern as well as a 2,000 days old RSI resistance line. After gold topped and got smashed, oil did never go above that RSI level for many years. First medium term buy signal came in shortly after gold had bottomed in 2015/2016 and at the end of 2017 it broke through that long term resistance line. I’m hoping oil is foretelling what is to come for gold.
Copper:
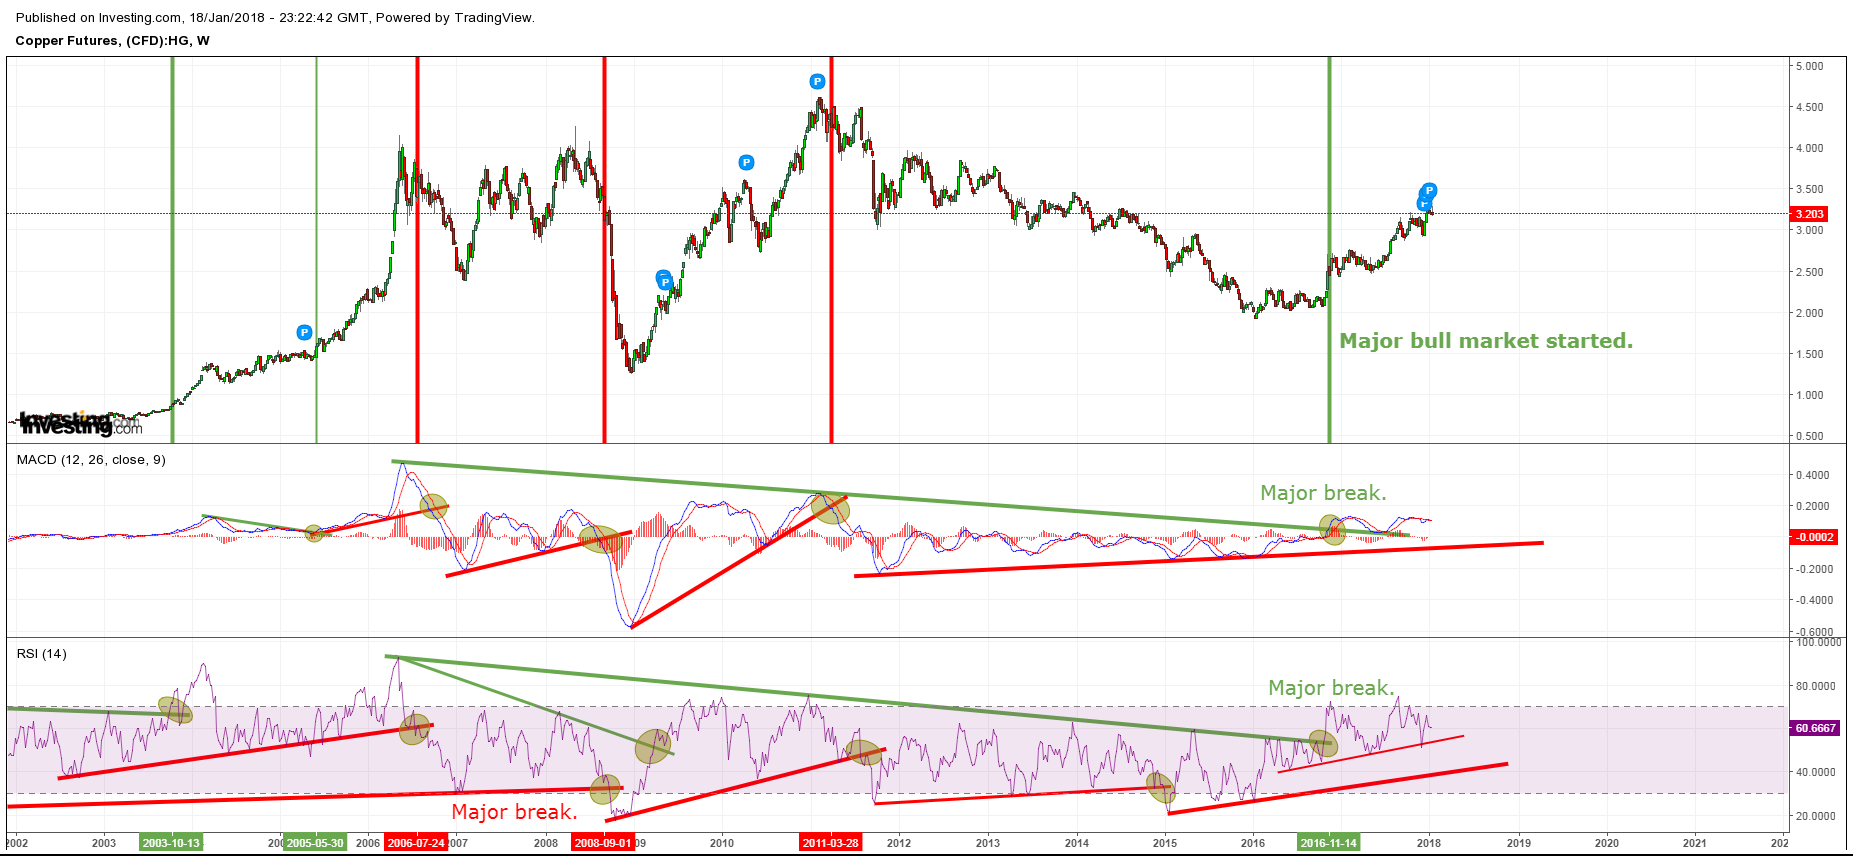
Copper (Weekly).
Major bullish signals have already been triggered (like in oil). We should be in for a multi year bull market in copper, and I reckon copper along with oil is as I said, foretelling what is to come for gold and after that silver.
Gold:
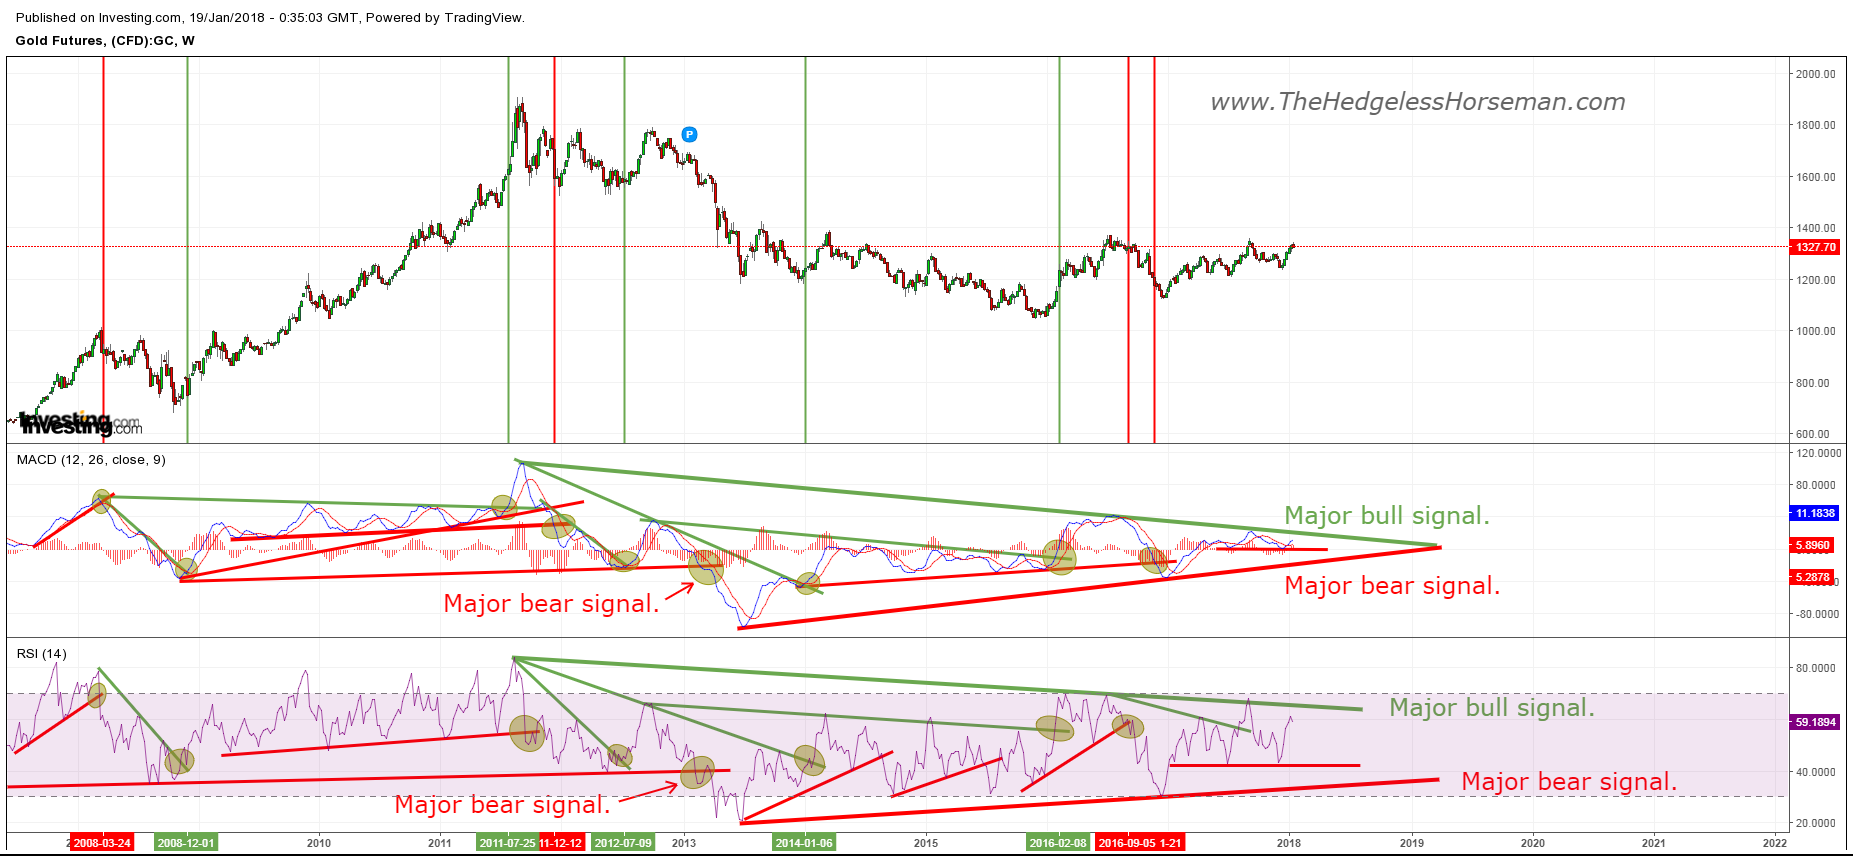
Gold (Weekly).
Gold triggered a big buy signal back in early 2016, but is yet to trigger the major one. It is close though. After the first run up in 2016, gold has not mustered up the strength to break through the major resistance line, although attempts were made in late 2017 for both RSi and MACD as you can see in the chart. Also note that another big signal was triggered in early 2011, but we all know what happened to the following bull run when it started to go vertical… CME jacked up margin requirements big time and killed the bull. We are pretty close to a major bear triggers, but thankfully closer to an ever bigger bull signals for both RSI and MACD.
Silver:

Silver (Weekly).
Silver is the hardest one to chart since it is very volatile and a much smaller market that the other three commodities. I didn’t draw every RSI and MACD trend line because the waves are often so small to even get a good overview without zooming in. Anyway, it really looks like silver has been coiling and been “kept in check” for the last two years. We got a bullish break in late 2016, but that rally was capped and we soon started to head down again. The situation for silver looks to be somewhat similar to gold. Both got their bullish breaks capped and RSI as well as MACD is just sluggishly moving along just below major buy signals.
Conclusion
It is my personal belief that we are truly in a medium to long term commodity bull market and that copper and oil are leading the way (both have had major bull signals triggered). Gold and silver on the other hand got capped a after they had their first larger buy signals triggered and now I am eagerly waiting for them to muster up the strength to deliver some new bullish breaks. Hopefully we will see the major buy signals get triggered in the weeks/months to come.
Disclaimer: This is not trading advice. I am merely describing my personal long term view. In the short term anything can happen and there are no guarantees that any of these big buy signals will get triggered and/or that they will indeed lead to sustained rallies.
Best regards,
The Hedgeless Horseman
Follow me on twitter: https://twitter.com/Comm_Invest
Follow me on CEO.ca: https://ceo.ca/@hhorseman
Don’t forget to sign up for my Newsletter (top right on front page) in order to get notification when a new post is up!