


Chart of The Day: Novo
Just an observation of some chart similarities between now and 2017:
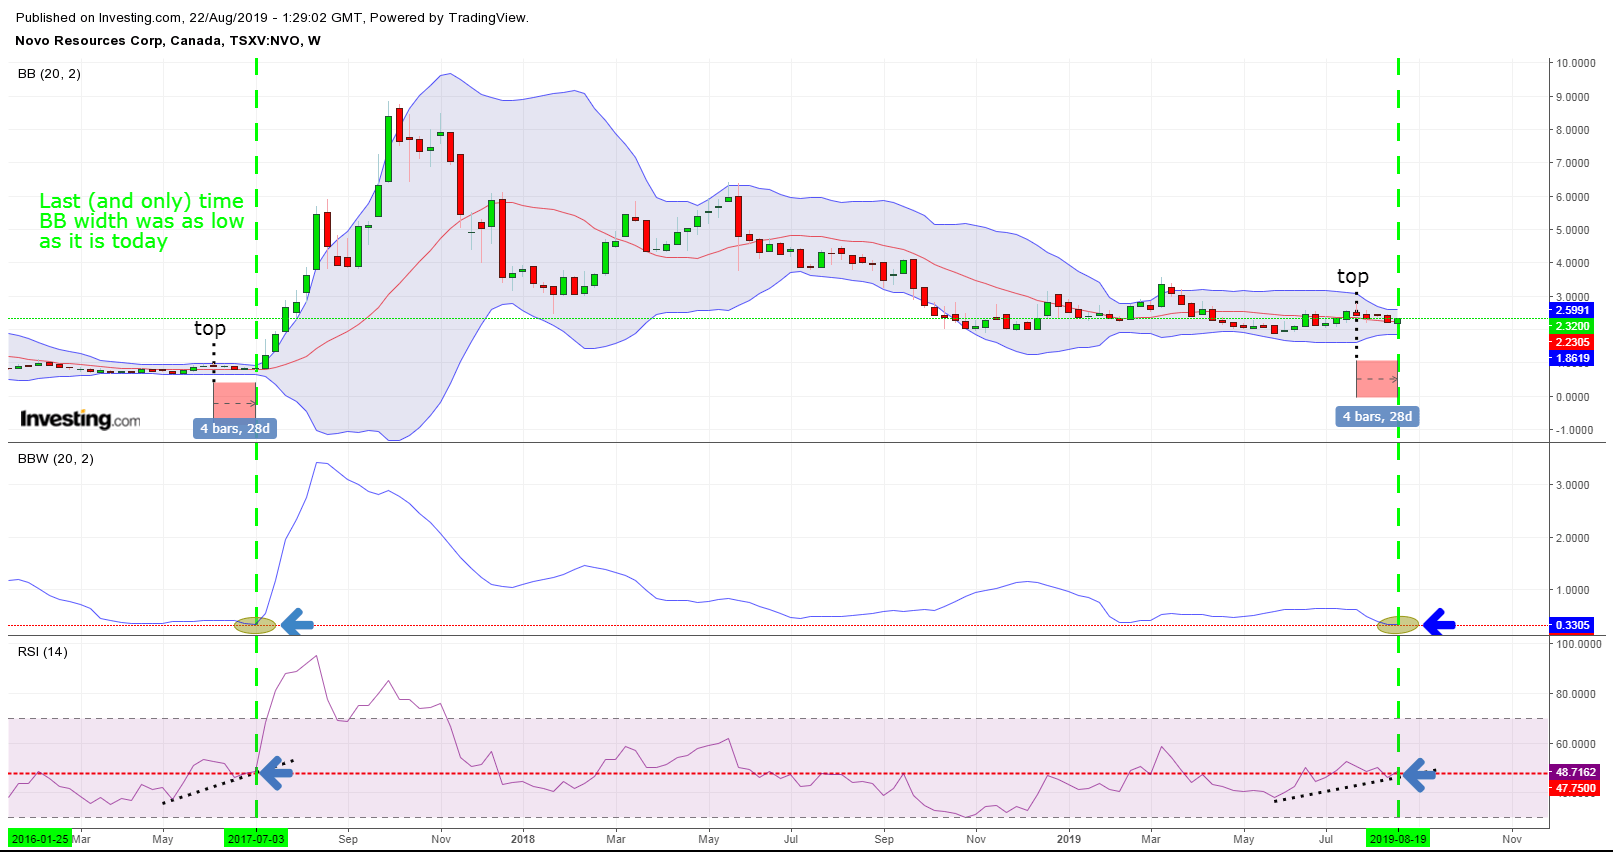
… Now a zoomed in view of the indicators, just to show how similar they really are:
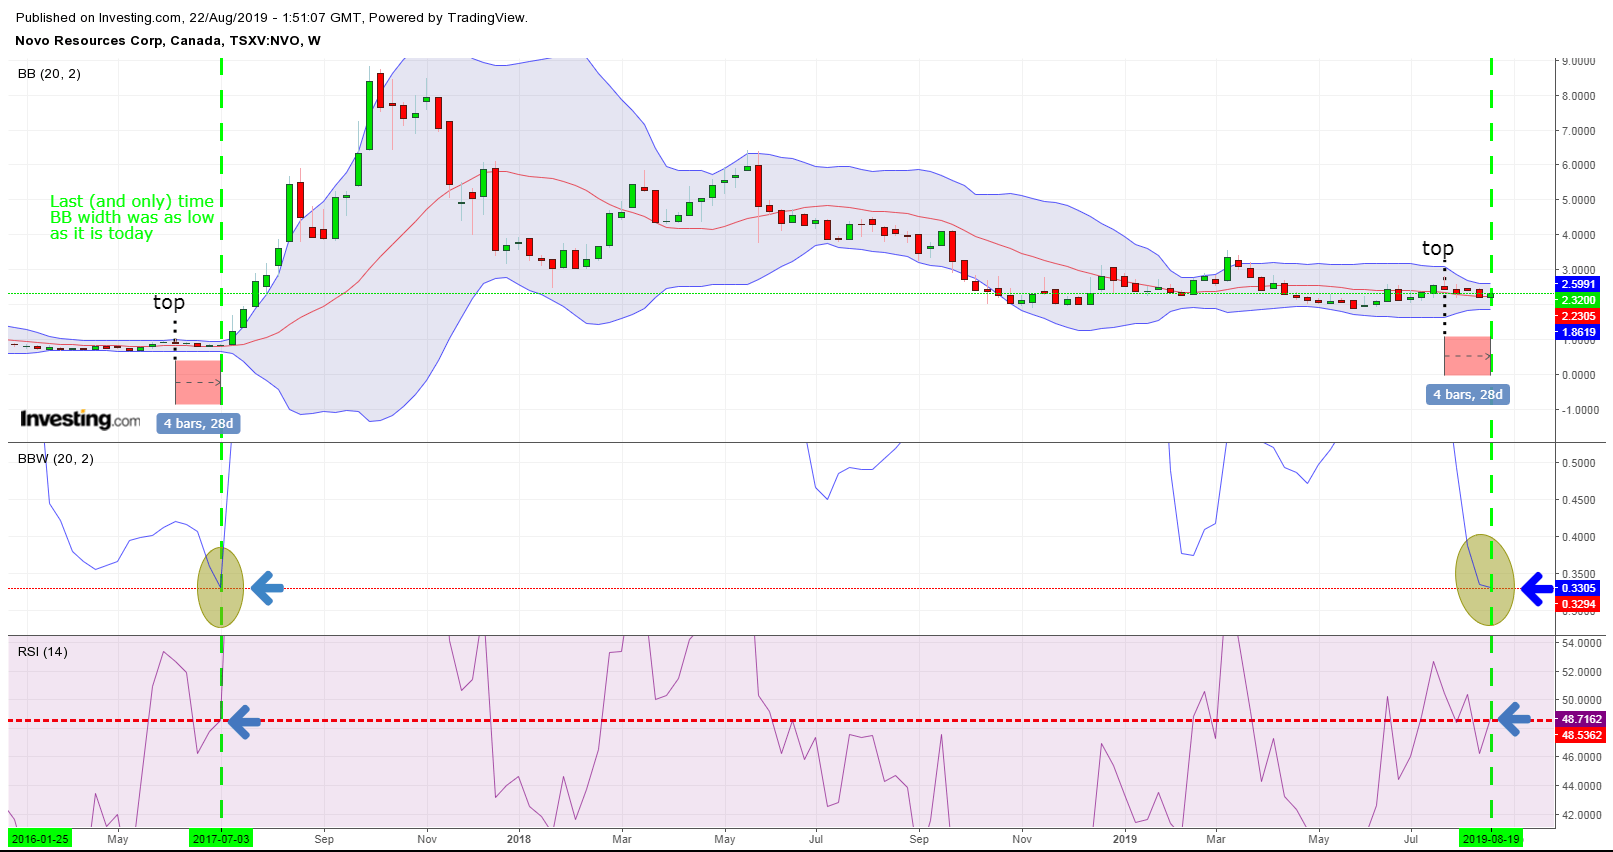
The BBW indicator which measures volatility has only been this low one other time for Novo and that was in early July of 2017. It basically means that the trading range is extremely (relatively speaking) tight at the moment and that there is no clear direction. We all know the saying; “The calm before the storm”, and that is probably what we are indeed experiencing right now because a very tight trading range often end with an explosive and powerful move. Now, I am personally expecting the share price to produce a very violent move within the next few weeks. With that said, I have no idea what will be the catalyst or what direction the share price will move. Last time we were at similar crossroads (this level of undecided/complacent share price) the move was up and kept going up until we had a blow off top at around $8.8/share, a few months later. The move actually saw the share price of Novo rise over 1,000% from bottom to top.
This is not trading advice and I have no idea if or what direction any potential large move will go!
(Note: This is not investment advice and I am not a geologist. Always do your own due diligence. I own a lot of shares of Novo Resources which I have bought in the open market and am thus biased. Novo is a passive banner sponsor on my site. )
Best regards,
The Hedgeless Horseman
Follow me on twitter: https://twitter.com/Comm_Invest
Follow me on CEO.ca: https://ceo.ca/@hhorseman