

Cartier Silver Intersects 49.19 g Ag/t, 1.35% Zn and 1.31% Pb over 44.76m in Discovery Hole on the Gonalbert Property, Potosi Department, Southern Bolivia
- This zone includes a higher-grade interval of 137.42 g Ag/t, 7.91% Zn and 5.6% Pb over 5.60m
- Other significant intersections in the Discovery Hole include:
- 57.74 g Ag/t and 1.75% Pb over 18.25m including 79.90 g Ag/t and 2.53% Pb over 6.63m
- 109.54 g Ag/t, 3.68% Zn and 4.44% Pb over 11.09m including 170.01 g Ag/t, 2.51% Zn and 7.00% Pb over 5.81m
- Channel sampling of the underground artisanal workings at Gonalbert returned the highest-grade values from the lower levels including 245.5 g Ag/t over 1.5m, 492.0 g Ag/t over 0.7m and 123.9 g Ag/t over 1.5m
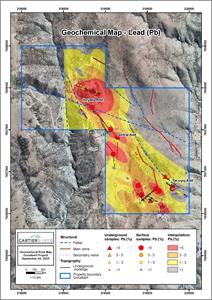
- Surface rock geochemical sampling has defined an extensive area of anomalous Ag and Pb extending for a strike length of approximately 2km that correlates well with the IP chargeability trends.
TORONTO, Sept. 07, 2023 (GLOBE NEWSWIRE) — Cartier Silver Corporation (CSE: CFE) (“Cartier Silver” or the “Company”) is pleased to report the first results from diamond drilling to test geological and geophysical targets for epithermal Ag-Pb-Zn mineralization on the Gonalbert Property, Potosi Department, Southern Bolivia. The initial program as previously reported (see Cartier Silver press release of June 29, 2023) consists of 5 drill holes totaling 3,300m collared in the general vicinity of the artisanal silver mine. To date 729.5m of drilling have been completed in two holes with a third hole in progress (Figure 1). Results have been received for drill hole DGL-01 as outlined in Table 1. Collar locations and orientations of these holes are listed in Table 2 below.
Tom Larsen, CEO of Cartier Silver, commented: “We are very pleased with the excellent result from the inaugural diamond drill campaign at Gonalbert. Initial values from our first hole demonstrate especially solid silver grades, along with significant lead and zinc. The channel sample values from the underground workings show consistency with silver head grades reported from recent mining activity. Regional geological and rock geochemical work on the property by our exploration team has outlined a prospective 2 kilometer long potentially silver-rich target area on Gonalbert. We are looking forward to receiving further results from this drilling program.”
Dr. Osvaldo Arce, P.Geo., General Manager of Cartier Silver’s Bolivian subsidiary, Minera Cartier S.R.L., said: “The ongoing surface and underground mapping, channel sampling and initial diamond drilling at the Gonalbert zone (southern part of the Chorrillos project), demonstrate that it is a Bolivian-type caldera hosted, polymetallic silver-dominant epithermal vein system, associated with Ordovician slates, and Miocene dacitic domes, dykes, and lithic tuffs. Vein-type and disseminated Ag-Zn-Pb mineralization occurs in subvertically continuous fault hosted veins, and replacements of brecciated faults. The widest and highest-grade veins are present in northwest trending faults which are readily evident in the geological and geophysical data.”
Dr. Arce continued: “The Chorrillos project area occurs along a ±100 km northwest structural corridor that includes known deposits such as Chorolque (Sn), Iska Iska (Ag-Sn-Zn-Pb), Tasna (Bi-Sn-W-Au) and other large Bolivian type polymetallic deposits. It is very likely that Gonalbert may host high temperature Sn porphyry-type mineralization at depth.”
Diamond Drilling Results
The Discovery Drill Hole DGL-01, as shown in Figure 1, was drilled to test the chargeability anomaly in the Central Adit area. This hole, which was drilled at an azimuth of 60 degrees and a dip of -70E, intersected a series of high-grade epithermal silver-lead-zinc zones within a broad mineralized envelope in altered metasediments associated with steeply dipping fault zones. Significant results are as follows:
- 57.74 g Ag/t and 1.75% Pb over 18.25m from 115.75m to 134.00m including 79.90 g Ag/t and 2.53% Pb over 6.63m from 115.75 to 122.38m.
- 49.19 g Ag/t, 1.35% Zn and 1.31% Pb over 44.76m from 347.10m to 391.86m including 137.42 g Ag/t, 7.91% Zn and 5.6% Pb over 5.60m from 347.10m to 352.70m.
- 109.54 g Ag/t, 3.68% Zn and 4.44% Pb over 11.09m from 418.89m to 429.98m including 170.01 g Ag/t, 2.51% Zn and 7.00% Pb over 5.81m from 418.89m to 424.70m.
The true width of these intersections is approximately 80%.
Table 1: Diamond Drill Hole Assay Results as at September 7, 2023, Gonalbert Property
| Hole # | From (m) | To (m) | Length (m) | Ag | Au | Zn | Pb | Cu | Sn |
| g/t | g/t | % | % | % | % | ||||
| DGL-01 | 98.69 | 103.42 | 3.88 | 74.24 | 0.10 | 0.01 | 4.28 | 0.04 | 0.01 |
| 115.75 | 134.00 | 18.25 | 57.74 | 0.12 | 0.01 | 1.75 | 0.03 | 0.01 | |
| Incl | 115.75 | 122.38 | 6.63 | 79.90 | 0.12 | 0.01 | 2.53 | 0.06 | 0.00 |
| 276.97 | 277.47 | 0.50 | 27.80 | 0.56 | 0.06 | 0.03 | 0.44 | 0.00 | |
| 333.76 | 335.56 | 1.80 | 80.48 | 0.20 | 3.37 | 2.64 | 0.02 | 0.01 | |
| 347.10 | 391.86 | 44.76 | 49.19 | 0.01 | 1.35 | 1.43 | 0.01 | 0.01 | |
| Incl | 347.10 | 352.70 | 5.60 | 137.42 | 0.02 | 7.91 | 5.60 | 0.03 | 0.01 |
| 418.89 | 429.98 | 11.09 | 109.54 | 0.05 | 3.68 | 4.44 | 0.02 | 0.02 | |
| Incl | 418.89 | 424.70 | 5.81 | 170.01 | 0.04 | 2.51 | 7.00 | 0.02 | 0.01 |
| 435.78 | 436.28 | 0.50 | 103.70 | 0.02 | 20.87 | 4.10 | 0.05 | 0.04 | |
Note: True width is approximately 80% of core length. Chemical symbols: Ag = silver, Au = gold, Zn = zinc, Pb = lead, Cu = copper and Sn = tin. Quantities are given in percent (%) for Zn, Pb Cu, Sn and in grams per tonne (g/t) for Ag and Au.
Underground Channel Sampling, Gonalbert Artisanal Mine
Underground channel sampling has been carried out in the Hoyada, Labor Central Rieles (Central Adit) and Tocoyoj artisanal underground workings (Figure 1). Results (Table 3) have been received for underground sampling at Central Adit where the main production shaft is located (Figure 1). Channel sampling was systematically carried out along the ENE and NNW-oriented drifts on the principal production levels including Level 0, 100, 160 and 180.
As shown in Figure 4, apart from one sample in level 0 which returned 504.0 g Ag/t over 0.52m, the best results were obtained in the lower levels including 245.5 g Ag/t over 1.5m, 492.0 g Ag/t over 0.7m and 123.9 g Ag/t over 1.5m. Ag and Pb correlate almost perfectly in the lower levels, indicating that the silver is largely contained within galena. Galena occurs with minor pyrite and chalcopyrite, providing the chargeability target that was mapped directly in the IP/Res survey.
Geophysical data suggest that the chargeable mineralization becomes stronger with depth, reaching a maximum at the 400m limit reached with the IP/Res survey. This trend to higher Ag and Pb values at greater depth is supported by the results of sampling over four levels from the surface to -180m in the drifts at Central Adit. Drilling to date has only partially tested the extensive chargeability anomaly.
Surface Rock Geochemical Sampling
A rock geochemical surface sampling program carried out over much the Gonalbert Property, has confirmed that Ag-Pb-Zn mineralization is associated with north-northwest trending structures inferred from the IP/Res and topographic surveys (see Cartier Silver press release of June 7, 2023). Silver values show the same strong correlation with galena (Pb) that is evident in the underground workings. The principal trend of mineralization is 310-330 degrees parallel to a set of north-northwest trending quartz dykes. The strong correlation of silver with galena indicates that the IP chargeability response from the galena (over 10% in some veins) can be used to effectively target the silver-bearing mineralization.
Figure 5 shows the distribution of Ag and Figure 6 that of Pb. Complete analytical results are given in Table 4. Samples taken are chip and channel samples.
Figure 1: Geology Plan Map of Gonalbert Property Showing Locations of Diamond Drill Holes and Artisanal Mine Workings
Figure 2: Geological Cross Section Discovery Hole DGL-01, Gonalbert
Figure 3: Chargeability Cross Section, Discovery Hole DGL-01, Gonalbert
Figure 4: Geological Cross Section showing Underground Channel Sampling, Gonalbert
Figure 5: Rock Geochemical Sampling, Gonalbert Property Showing Ag Distribution
Figure 6: Rock Geochemical Sampling, Gonalbert Property Showing Ag Distribution
Table 2: Summary of Diamond Drill Hole Coordinate in Gonalbert
| Hole No. | Collar Easting | Collar Northing | Elev. | Azimuth | Angle | Hole Length (m) |
| Holes Assays Reported | ||||||
| DGL-01 | 219000.0 | 7637460.0 | 3669.5 | 60° | -70° | 457.0 |
| Subtotal | 457.0 | |||||
| Holes Assays Pending and In Progress | ||||||
| DGL-02 | 219214.7 | 7637583.9 | 3581.8 | 60 | -70° | 272.5 |
| DGL-03 | 218742.2 | 7637542.2 | 3596.3 | 60 | -50° | In progress |
| Subtotal | 272.50 | |||||
| TOTAL | 729.50 | |||||
Table 3: Results of Underground Channel Sampling
| SAMPLE # | UG LEVEL | EASTING | NORTHING | ELEV. | WIDTH (m) | STRIKE | DIP | Ag g/t | Au g/t | Pb % | Zn % | Cu % | Sn % |
| GLC-01 | – 160 | 219040 | 7637477 | 3432 | 1.25 | 130 | 80 | 0.6 | 0.03 | 0.0 | 0.0 | < 0.005 | 0.01 |
| GLC-02 | – 160 | 219023 | 7637474 | 3431 | 0.70 | 292 | 77 | 0.9 | 0.03 | 0.0 | 0.0 | < 0.005 | < 0.005 |
| GLC-03 | – 160 | 219003 | 7637493 | 3432 | 0.58 | 145 | 64 | 82.5 | 0.04 | 4.0 | 8.8 | 0.02 | 0.01 |
| GLC-04 | – 160 | 219004 | 7637496 | 3432 | 0.86 | 308 | 81 | 89.2 | 0.05 | 3.6 | 2.9 | 0.03 | < 0.005 |
| GLC-05 | – 160 | 219002 | 7637515 | 3427 | 0.47 | 322 | 88 | 73.0 | 0.06 | 4.5 | 10.8 | 0.03 | 0.01 |
| GLC-07 | – 160 | 218979 | 7637538 | 3433 | 1.45 | 117 | 72 | 49.0 | 0.04 | 2.8 | 5.9 | 0.03 | 0.01 |
| GLC-08 | – 160 | 218968 | 7637562 | 3434 | 1.00 | 125 | 76 | 2.0 | 0.04 | 0.0 | 0.1 | < 0.005 | 0.01 |
| GLC-09 | – 160 | 218952 | 7637594 | 3437 | 1.60 | 185 | 68 | 12.6 | 0.14 | 0.4 | 2.3 | 0.01 | < 0.005 |
| GLC-10 | – 160 | 218955 | 7637614 | 3434 | 1.10 | 117 | 84 | 23.4 | 0.14 | 0.3 | 0.4 | 0.01 | < 0.005 |
| GLC-11 | – 160 | 218909 | 7637675 | 3436 | 1.35 | 120 | 83 | 245.4 | 0.04 | 9.9 | 19.1 | 0.04 | 0.04 |
| GLC-12 | – 160 | 218887 | 7637703 | 3436 | 1.30 | 300 | 74 | 56.5 | 0.04 | 2.4 | 14.7 | 0.03 | 0.02 |
| GLC-13 | – 160 | 218878 | 7637711 | 3436 | 1.35 | 312 | 76 | 67.4 | 0.04 | 3.2 | 22.0 | 0.03 | 0.03 |
| GLC-15 | – 160 | 218852 | 7637755 | 3438 | 1.63 | 315 | 78 | 55.5 | 0.09 | 1.9 | 11.0 | 0.02 | 0.02 |
| GLC-16 | – 180 | 219032 | 7637476 | 3405 | 2.20 | 88 | 47 | 2.1 | 0.18 | 0.0 | 0.3 | < 0.005 | < 0.005 |
| GLC-17 | – 180 | 218992 | 7637513 | 3406 | 0.70 | 152 | 82 | 492.0 | 0.04 | 19.8 | 5.9 | 0.02 | < 0.005 |
| GLC-18 | – 180 | 218966 | 7637559 | 3407 | 1.00 | 248 | 82 | 3.6 | 0.06 | 0.3 | 0.5 | < 0.005 | < 0.005 |
| GLC-19 | – 180 | 218957 | 7637577 | 3407 | 1.50 | 348 | 79 | 123.9 | 0.07 | 6.6 | 3.3 | 0.09 | < 0.005 |
| GLC-20 | – 180 | 218895 | 7637684 | 3409 | 2.70 | 154 | 72 | 16.3 | 0.10 | 0.3 | 12.5 | 0.03 | 0.02 |
| GLC-21 | – 180 | 218921 | 7637666 | 3409 | 1.50 | 285 | 88 | 31.9 | 0.04 | 1.1 | 10.8 | 0.02 | 0.02 |
| GLC-23 | 0 | 219134 | 7637509 | 3588 | 1.40 | 146 | 46 | 1.5 | 0.03 | 0.1 | 0.3 | < 0.005 | < 0.005 |
| GLC-24 | 0 | 219102 | 7637495 | 3590 | 1.10 | 238 | 13 | 1.3 | 0.02 | 0.2 | 0.4 | < 0.005 | 0.01 |
| GLC-25 | 0 | 219096 | 7637492 | 3589 | 1.30 | 234 | 44 | 4.1 | 0.03 | 0.2 | 0.0 | 0.03 | 0.01 |
| GLC-26 | 0 | 219068 | 7637480 | 3589 | 0.60 | 325 | 65 | 54.2 | 0.04 | 4.3 | 0.0 | 0.06 | 0.01 |
| GLC-27 | 0 | 219063 | 7637478 | 3590 | 0.50 | 240 | 53 | 504.0 | 0.04 | 15.6 | 0.0 | 0.07 | < 0.005 |
| GLC-28 | 0 | 219013 | 7637457 | 3590 | 1.50 | 234 | 27 | 2.7 | 0.02 | 0.2 | 0.0 | 0.01 | < 0.005 |
Table 4: Results of Surface Rock Geochemical Sampling
| POINT | SAMPLE # | EASTING | NORTHING | ELEV. | WIDTH (m) | STRIKE | DIP | Ag g/t | Au g/t | Pb % | Zn % | Cu % | Sn % |
| SJ1 | GSJ-01 | 219434 | 7636725 | 3613 | 0.40 | 130 | 75 | 170 | 0.03 | 7.36 | 0.67 | 0.11 | 0.01 |
| SJ2 | GSJ-02 | 219546 | 7637763 | 3622 | 0.39 | 168 | 82 | 3 | 0.01 | 0.01 | 0.01 | 0.00 | 0.01 |
| SJ3 | GSJ-03 | 219603 | 7637753 | 3613 | 0.23 | 188 | 79 | 1 | 0.02 | 0.01 | 0.03 | 0.03 | 0.20 |
| SJ4 | GSJ-04 | 219634 | 7637631 | 3591 | 1.60 | 137 | 60 | 1 | 0.01 | 0.08 | 0.10 | 0.00 | 0.00 |
| SJ5 | GSJ-05 | 219396 | 7637643 | 3599 | 0.40 | 283 | 50 | 1 | 0.01 | 0.00 | 0.28 | 0.02 | 0.00 |
| SJ6 | GSJ-06 | 219438 | 7637621 | 3585 | 0.70 | 61 | 58 | 1 | 0.01 | 0.05 | 0.27 | 0.01 | 0.01 |
| SJ7 | GSJ-08 | 219641 | 7637409 | 3557 | 0.30 | 139 | 80 | 2 | 1.84 | 0.04 | 0.05 | 0.02 | 0.03 |
| SJ8 | GSJ-09 | 219423 | 7637568 | 3587 | 0.36 | 316 | 83 | 1 | 0.01 | 0.01 | 0.25 | 0.03 | 0.01 |
| SJ9 | GSJ-10 | 219778 | 7637341 | 3507 | 0.64 | 102 | 63 | 3 | 0.23 | 0.01 | 0.04 | 0.01 | 0.00 |
| SJ10 | GSJ-11 | 218770 | 7638456 | 3590 | 0.35 | 4 | 66 | 4 | 0.04 | 0.08 | 0.11 | 0.02 | 0.01 |
| GN-2 | GSJ-13 | 218735 | 7637999 | 3575 | 0.38 | 104 | 80 | 63 | 0.02 | 3.61 | 0.82 | 0.02 | 0.02 |
| GN-4 | GSJ-14 | 218797 | 7637971 | 3593 | 0.40 | 303 | 85 | 31 | 0.02 | 0.86 | 1.84 | 0.02 | 0.01 |
| G11 | GSJ-15 | 218509 | 7638159 | 3551 | 0.23 | 308 | 80 | 4 | 0.07 | 0.06 | 0.01 | 0.00 | 0.01 |
| G16 | GSJ-16 | 218679 | 7638208 | 3571 | 0.24 | 312 | 84 | 2 | 0.24 | 0.26 | 0.08 | 0.01 | 0.01 |
| G20 | GSJ-17 | 218896 | 7637940 | 3584 | 0.23 | 116 | 72 | 123 | 0.04 | 2.24 | 0.20 | 0.02 | 0.02 |
| G32 | GSJ-18 | 219417 | 7636627 | 3626 | 0.36 | 162 | 81 | 29 | 0.01 | 0.94 | 0.01 | 0.00 | 0.00 |
| G37 | GSJ-19 | 219119 | 7636846 | 3599 | 0.40 | 336 | 70 | 39 | 0.19 | 2.60 | 0.03 | 0.02 | 0.01 |
| G44 | GSJ-20 | 219113 | 7637113 | 3629 | 0.50 | 8 | 66 | 32 | 0.03 | 1.10 | 0.00 | 0.01 | 0.01 |
| G54 | GSJ-22 | 219098 | 7637170 | 3644 | 0.80 | 175 | 88 | 21 | 0.03 | 0.28 | 0.01 | 0.00 | 0.02 |
| G62 | GSJ-23 | 219094 | 7637210 | 3651 | 0.10 | 322 | 70 | 4,160 | 0.27 | 21.00 | 0.01 | 0.01 | 1.65 |
| G82 | GSJ-24 | 219101 | 7637043 | 3626 | 0.20 | 135 | 78 | 28 | 0.03 | 0.61 | 0.00 | 0.00 | 0.01 |
| G92 | GSJ-25 | 219144 | 7637367 | 3623 | 0.45 | 172 | 55 | 31 | 0.02 | 1.50 | 0.01 | 0.04 | 0.02 |
| G101 | GSJ-26 | 219063 | 7637508 | 3639 | 0.80 | 134 | 70 | 102 | 0.12 | 5.34 | 0.02 | 0.03 | 0.04 |
| G117 | GSJ-28 | 218728 | 7637707 | 3618 | 0.50 | 140 | 80 | 1 | 0.02 | 0.03 | 0.01 | 0.01 | 0.00 |
| GO10 | GSJ-29 | 219032 | 7636547 | 3592 | 0.40 | 174 | 80 | 9 | 0.01 | 0.76 | 0.16 | 0.01 | 0.02 |
| GO31 | GSJ-30 | 219384 | 7637186 | 3549 | 0.25 | 4 | 85 | 61 | 0.01 | 1.58 | 0.35 | 0.03 | 0.01 |
| GO37 | GSJ-31 | 219606 | 7636797 | 3574 | 2.00 | Dump sample | Dump sample | 483 | 0.08 | 19.50 | 0.10 | 0.08 | 0.05 |
| GO56 | GSJ-33 | 219560 | 7636653 | 3616 | 0.25 | 178 | 52 | 23 | 0.01 | 0.30 | 0.00 | 0.01 | 0.00 |
| GO66 | GSJ-34 | 219812 | 7636807 | 3506 | 0.37 | 125 | 45 | 179 | 0.04 | 18.25 | 0.10 | 0.07 | 0.04 |
| GO71 | GSJ-35 | 219892 | 7636825 | 3474 | 0.70 | 122 | 68 | 8 | 0.04 | 0.31 | 0.06 | 0.03 | 0.00 |
| GO74 | GSJ-36 | 219843 | 7636733 | 3507 | 0.40 | 115 | 40 | 8 | 0.29 | 0.05 | 0.03 | 3.67 | 17.80 |
| GO84 | GSJ-37 | 219613 | 7637925 | 3623 | 4.00 | 12 | 60 | 4 | 0.06 | 0.10 | 0.02 | 0.03 | 0.02 |
| GO90 | GSJ-38 | 219551 | 7637557 | 3553 | 0.30 | 134 | 64 | 1 | 0.01 | 0.10 | 0.18 | 0.01 | 0.02 |
| GO93 | GSJ-40 | 219500 | 7637524 | 3536 | 0.12 | 128 | 82 | 8 | 0.01 | 0.17 | 0.62 | 0.00 | 0.01 |
| GO102 | GSJ-41 | 219311 | 7637635 | 3569 | 0.20 | 75 | 75 | 2 | 0.01 | 0.02 | 0.08 | 0.02 | 0.00 |
| GO118 | GSJ-42 | 219062 | 7637539 | 3638 | 2 | stockwork | stockwork | 5 | 0.09 | 0.38 | 0.00 | 0.01 | 0.02 |
| GO120 | GSJ-43 | 219036 | 7637562 | 3632 | 0.45 | 322 | 74 | 73 | 0.12 | 1.53 | 0.09 | 0.03 | 0.02 |
| GO137 | GSJ-44 | 219752 | 7636941 | 3474 | 0.2 | 110 | 65 | 92 | 0.07 | 3.29 | 0.02 | 0.02 | 0.02 |
| G0144 | GSJ-45 | 219572 | 7637030 | 3520 | 3 | 132 | 62 | 64 | 0.06 | 0.33 | 0.27 | 0.01 | 0.04 |
| G0147 | GSJ-46 | 219474 | 7637231 | 3524 | 0.18 | 144 | 86 | 3 | 0.05 | 0.82 | 0.22 | 0.02 | 0.01 |
| GN2 | GSJ-47 | 219797 | 7637258 | 3500 | 1.2 | 160 | 25 | 4 | 0.10 | 0.11 | 0.01 | 5.04 | 0.01 |
| GO180 | GSJ-51 | 218712 | 7638156 | 3592 | 0.12 | 285 | 62 | 5 | 0.60 | 0.14 | 0.15 | 0.05 | 0.00 |
| GO205 | GSJ-55 | 219082 | 7638432 | 3674 | 0.1 | 310 | 79 | 2 | 0.22 | 0.12 | 0.12 | 0.00 | 0.00 |
| GO216 | GSJ-56 | 219348 | 7637893 | 3595 | 0.1 | 315 | 77 | 1 | 0.03 | 0.02 | 0.08 | 0.00 | 0.00 |
| GO221 | GSJ-57 | 218815 | 7637502 | 3639 | 0.5 | 140 | 78 | 39 | 0.03 | 1.24 | 0.26 | 0.02 | 0.03 |
| GG3 | GSJ-72 | 219853 | 7636739 | 3495 | 0.2 | 135 | 30 | 7 | <0.01 | 0.65 | 0.65 | 0.00 | <0.005 |
| G8 | GSJ-73 | 219798 | 7636797 | 3511 | 0.25 | 170 | 22 | 153 | 0.05 | 5.16 | 0.08 | 0.14 | 0.02 |
| G35 | GSJ-74 | 219728 | 7636426 | 3601 | 2 | Dump sample | Dump sample | 345 | 0.03 | 12.70 | 0.28 | 0.03 | 0.35 |
| G53 | GSJ-78 | 219877 | 7636754 | 3497 | 0.2 | 190 | 15 | 21 | 0.07 | 2.98 | 0.12 | 0.16 | 0.01 |
| G63 | GSJ-80 | 218840 | 7637768 | 3597 | 0.07 | 93 | 82 | 44 | 0.21 | 8.52 | 0.06 | 0.07 | 0.02 |
| GG4 | GSJ-81 | 219643 | 7636770 | 3557 | 0.40 | 140 | 64 | 347 | 0.11 | 14.20 | 0.16 | 0.09 | 0.03 |
| GG5 | GSJ-83 | 219479 | 7636807 | 3590 | 0.35 | 170 | 41 | 5 | <0.01 | 0.18 | 0.02 | 0.00 | <0.005 |
| G85 | GSJ-85 | 219678 | 7636668 | 3563 | 0.15 | 175 | 37 | 33 | 0.02 | 0.72 | 0.00 | 0.02 | 0.02 |
| GO211 | GSJ-139 | 219390 | 7636837 | 3595 | 0.40 | 340 | 82 | 428 | 0.07 | 12.05 | 0.01 | 0.02 | NA |
| G0212 | GSJ-140 | 219286 | 7636789 | 3594 | 0.40 | 314 | 55 | 11 | <0.01 | 1.02 | 0.01 | 0.00 | NA |
| GO215 | GSJ-142 | 219265 | 7636921 | 3594 | 0.30 | 155 | 55 | 179 | 0.10 | 0.41 | 0.01 | 0.01 | NA |
| GO208 | GSJ-143 | 219861 | 7637316 | 3468 | 0.30 | 114 | 30 | 75 | 0.05 | 0.03 | 0.03 | 2.82 | NA |
| GO203 | GSJ-144 | 219905 | 7637170 | 3433 | 2.00 | 138 | 32 | 220 | 0.05 | 0.02 | 0.01 | 0.02 | NA |
| GO209 | GSJ-145 | 219845 | 7637211 | 3492 | 0.15 | 190 | 18 | 2 | 0.01 | 0.02 | 0.01 | 3.17 | NA |
| Note: NA = not analyzed | |||||||||||||
Qualified Person
Dr. Bill Pearson, P.Geo., a Qualified Person (QP) as defined under National Instrument 43-101 (NI 43-101), has reviewed and approved the scientific and technical content of this press release. Dr. Chris Hale, P.Geo., supervised the geophysical surveys. Geological surveys and diamond drill logging and sampling were supervised by Dr. Osvaldo Arce, P.Geo. Messrs Hale and Arce are QPs as defined by NI 43-101.
Rock geochemical sampling program was directed by Dr. Osvaldo Arce, P.Geo. Underground channel sampling was employed whereas for the surface rock geochemical program both channel and chip sampling method were employed.
Cartier Silver is utilizing both ALS and AHK for drill core analysis, both of whom are major international accredited laboratories. Drill samples sent to ALS are prepared in both ALS Bolivia Ltda’s preparation facility in Oruro, Bolivia and the preparation facility operated by AHK in Tupiza with pulps sent to the main ALS Global laboratory in Lima for analysis. Cartier Silver employs an industry standard QA/QC program with standards, blanks and duplicates inserted into each batch of samples analyzed with selected check samples sent to a separate accredited laboratory.
Drill core samples sent to AHK Laboratories are prepared in a preparation facility installed and managed by AHK in Tupiza with pulps sent to the AHK laboratory in Lima, Peru. Check samples between ALS and AHK are regularly done as a QA/QC check. AHK is following the same analytical protocols used as with ALS and with the same QA/QC protocols.
About Cartier Silver Corporation
Cartier Silver is an exploration and development Company focused on discovering and developing its recently acquired silver property assets, including the Chorrillos Project and claims staked by the Company’s subsidiary, all of which are located in the Potosi Department of southern Bolivia. The Company also holds significant iron ore resources at its Gagnon Holdings in the southern Labrador Trough region of east-central Quebec, and the Big Easy gold property in the Burin Peninsula epithermal gold belt in the Avalon Zone of eastern Newfoundland and Labrador.
For further information please visit Cartier Silver’s website at www.cartiersilvercorp.com
For further information please contact:
| Thomas G. Larsen | Jorge Estepa |
| Chief Executive Officer | Vice-President |
| (800) 360-8006 | (800) 360-8006 |
| (416) 360-8006 | (416) 360-8006 |
The CSE has not reviewed nor accepts responsibility for the adequacy or accuracy of this release.
Statements in this release that are not historical facts are “forward-looking statements” and readers are cautioned that any such statements are not guarantees of future performance, and that actual developments or results, may vary materially from those in these “forward-looking statements”.
Photos accompanying this announcement are available at
https://www.globenewswire.com/NewsRoom/AttachmentNg/157827cf-eef1-4ca7-9c98-0b12a045f95d
https://www.globenewswire.com/NewsRoom/AttachmentNg/9b82d2ab-2c33-4c23-8062-bf19814816c8
https://www.globenewswire.com/NewsRoom/AttachmentNg/13ebe094-95e9-4e00-99f5-279ac96e9e13
https://www.globenewswire.com/NewsRoom/AttachmentNg/6ce602bd-92cc-413c-b3eb-e6a8f6a0e207
https://www.globenewswire.com/NewsRoom/AttachmentNg/cb1c1509-5430-4b22-aba3-08d9ca81d436
https://www.globenewswire.com/NewsRoom/AttachmentNg/535d7e48-9fe9-478f-88df-9569e3a3b9f4
PDF available: http://ml.globenewswire.com/Resource/Download/3c116bfb-55db-45b8-b578-f87f61a1c9bd

![]()
Figure 1
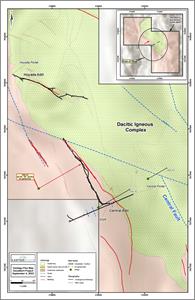
Geology Plan Map of Gonalbert Property Showing Locations of Diamond Drill Holes and Artisanal Mine Workings
Figure 2
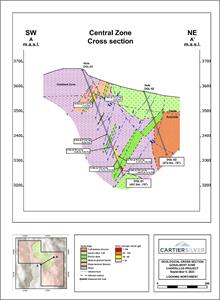
Geological Cross Section Discovery Hole DGL-01, Gonalbert
Figure 3
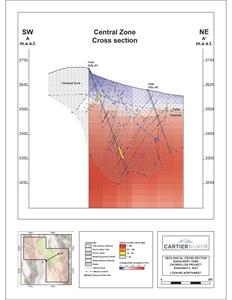
Chargeability Cross Section, Discovery Hole DGL-01, Gonalbert
Figure 4
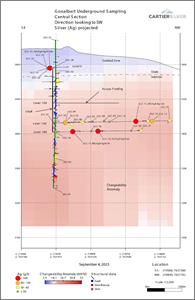
Geological Cross Section showing Underground Channel Sampling, Gonalbert
Figure 5
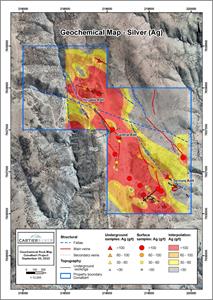
Rock Geochemical Sampling, Gonalbert Property Showing Ag Distribution
Figure 6