


Charts of the Day: Gold vs Bitcoin
I decided to compare the charts of two “alternative currencies”, namely gold and the relatively new phenomena Bitcoin. One having been a monetary asset for millennia and the other one being a new digital form of currency for the lack of a better word.
The charts actually look eerily similar…
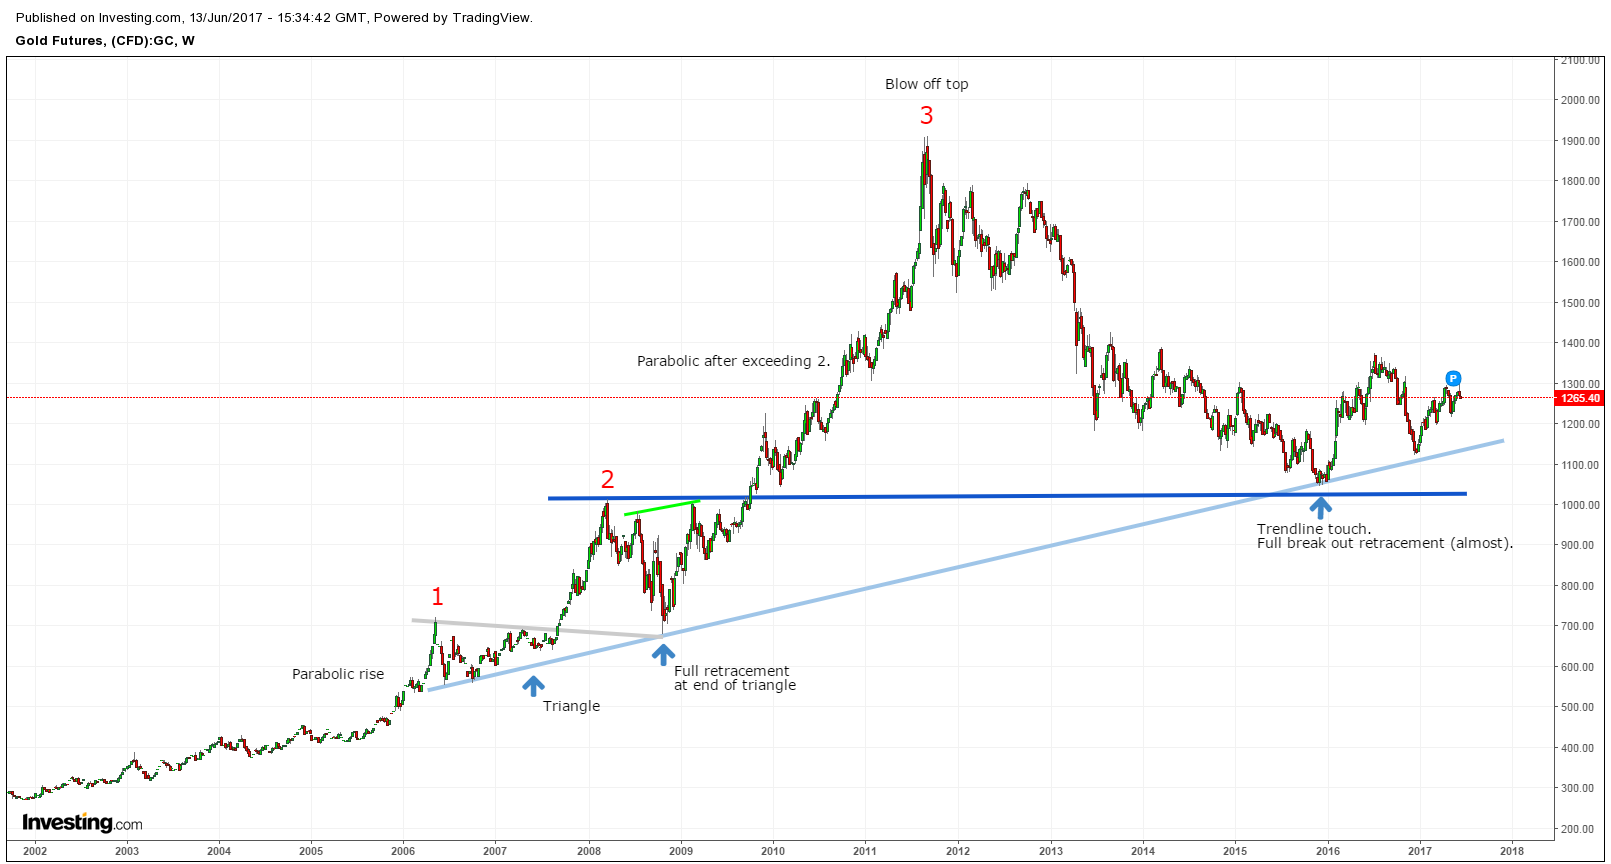
Gold (USD).
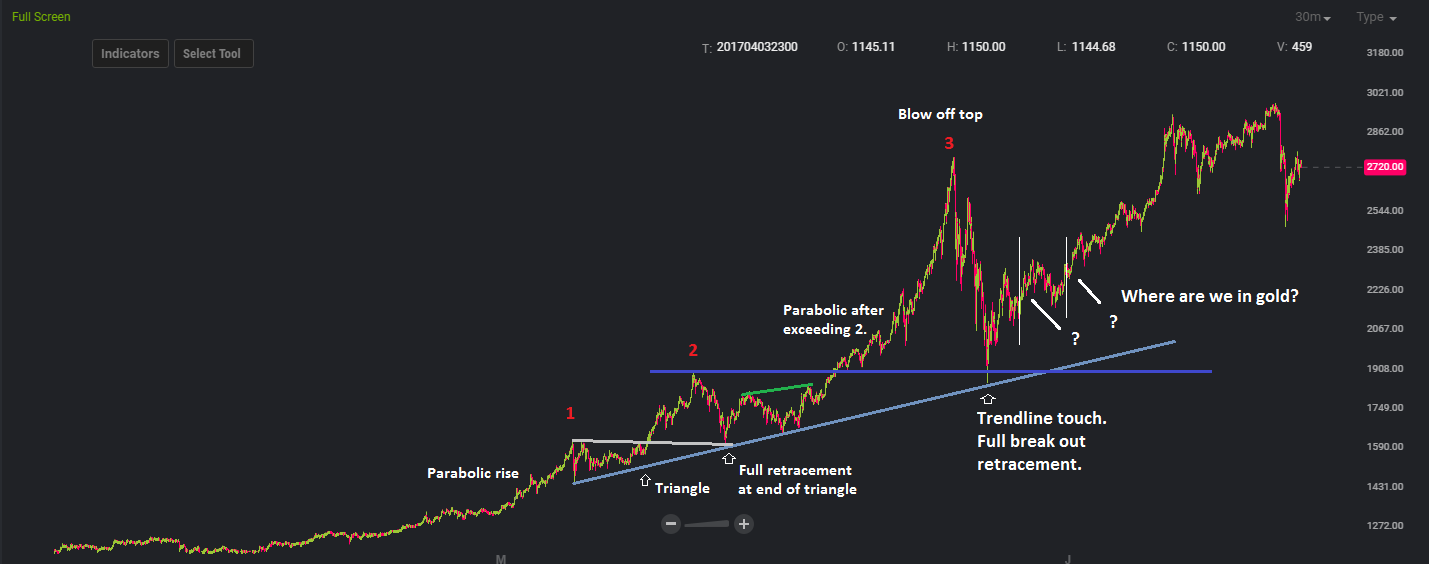
Bitcoin (USD).
Of course, other people might draw some lines in a different way, but there is no denying that on a first look, the price action before top 1 up until top 3 share many similarities (One should note however that the time scales are not the same). Since the Bitcoin pattern seems more “advanced”, one might hope that the subsequent action after the big correction off of top 3 is a prelude to what might develop in the gold space in the coming years.


On daily chart of bitcoin we see a big bullish impulse coming to and end with red wave 5. Red wave 5 is now trading around 2800 region and may ideally reach the Fibonacci ratio of 0.618, where bulls can slowdown and a on 4 hour chart and 1 day chart .. butterfly formation .. lets see how it will play out.