


Charts of the Day: Rally in Base Metals… What Does it Mean For Gold?
I have been reading a bunch of negative comments regarding gold lately. This Isn’t that surprising since first of all, the COT -report showed managed money (semi dumb money) pushing up their net long positions past recent highs:
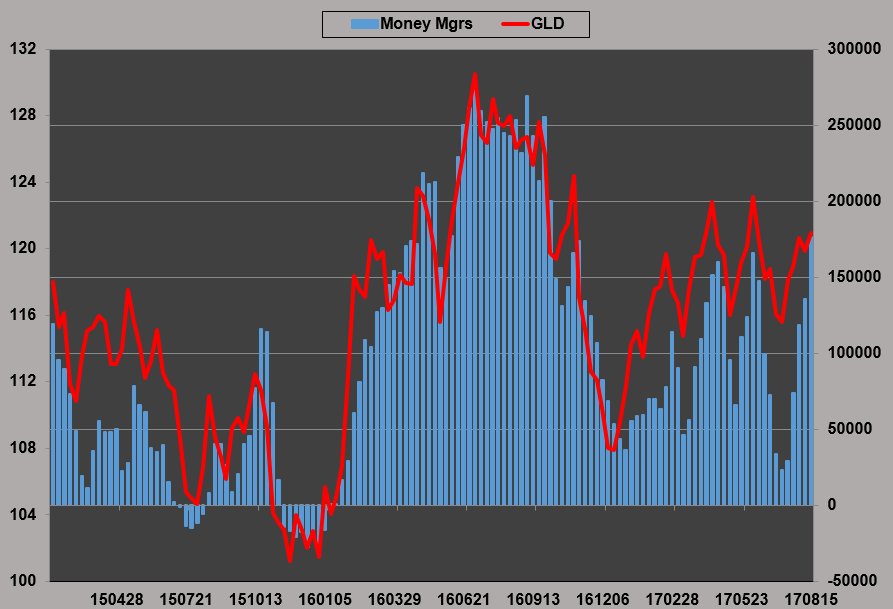
Gold COT-report: Managed money. (Source: David brady – twitter.com/GlobalProTrader).
Friday also delivered a VERY ugly “shooting start” candlestick on the daily chart (a sign of reversal). What’s even worse is that this took place around the seemingly impregnable $1300 level that has turned out to be a reversal point many times before:
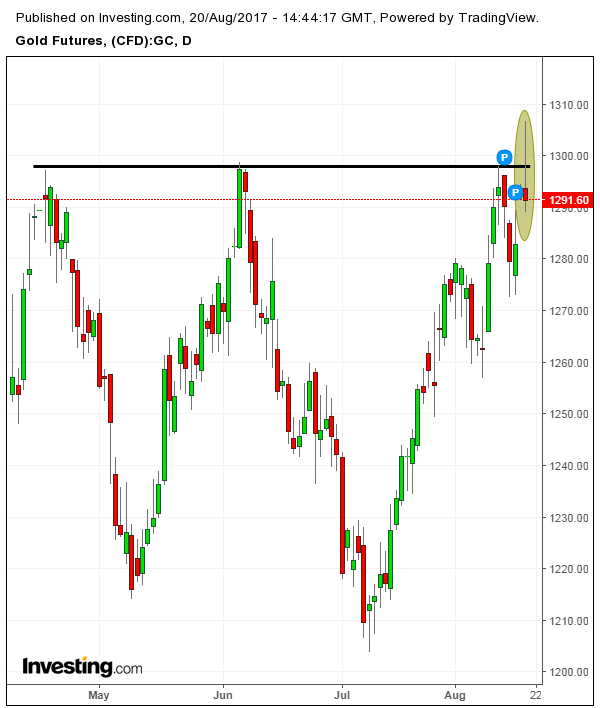
Gold (Daily).
… The problem I have with the “deflationists” calling for a gold crash is that the base metals have shown a quite bit of strength over the past weeks… Copper seems to have broken out of a multi year hedge. On top of that, zinc has pushed through multi year trend lines, a huge resistance zone and even out of a multi month trading range (that also negated a potential bearish Head and Shoulders reversal pattern):
Copper
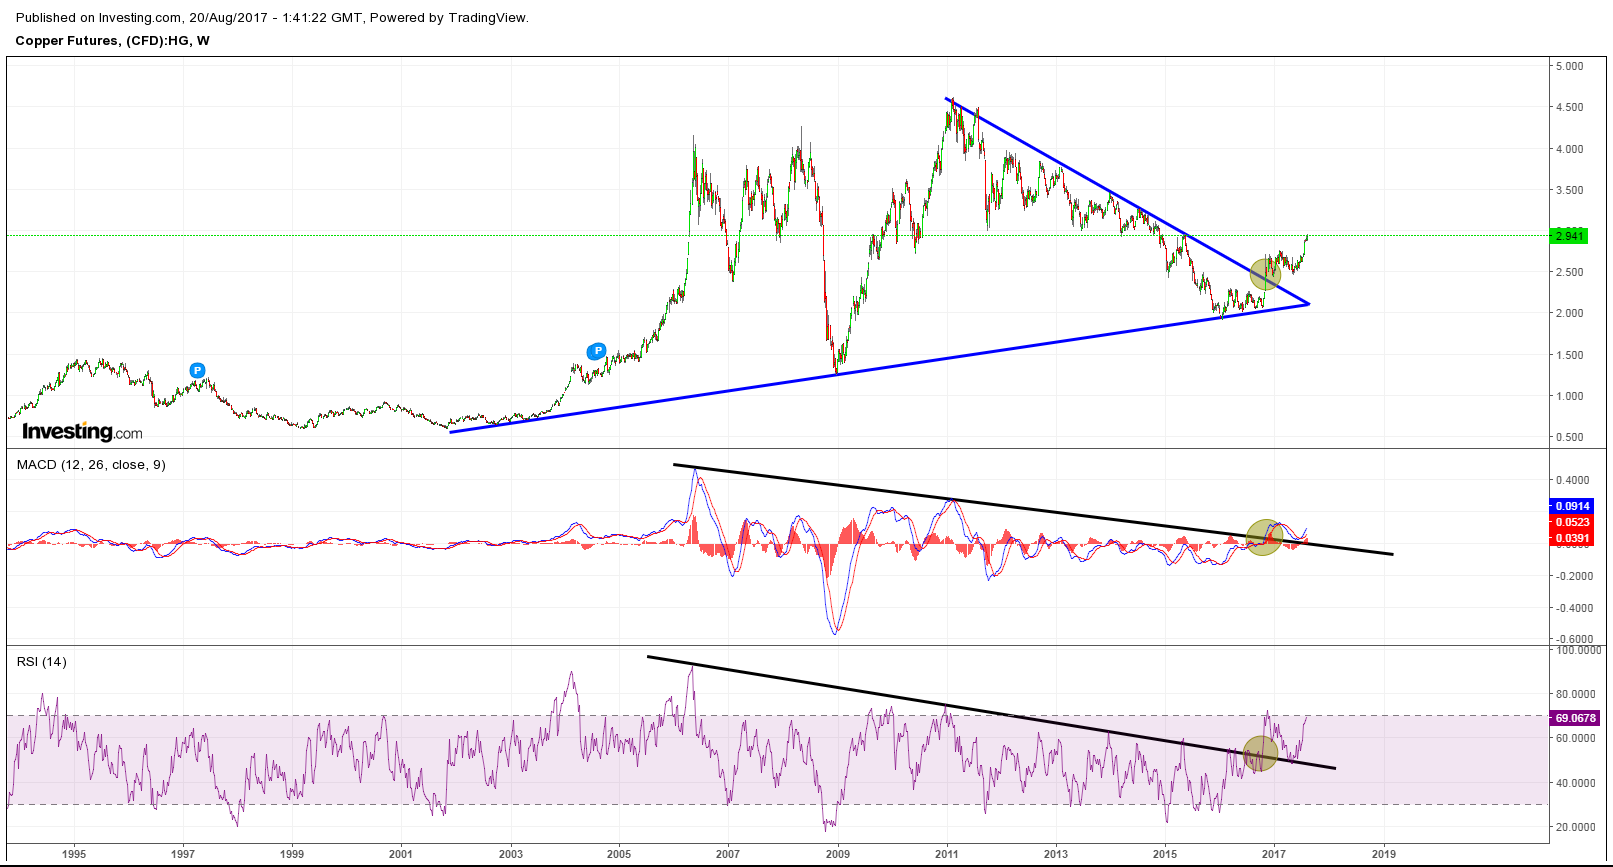
Copper (Weekly).
Zinc
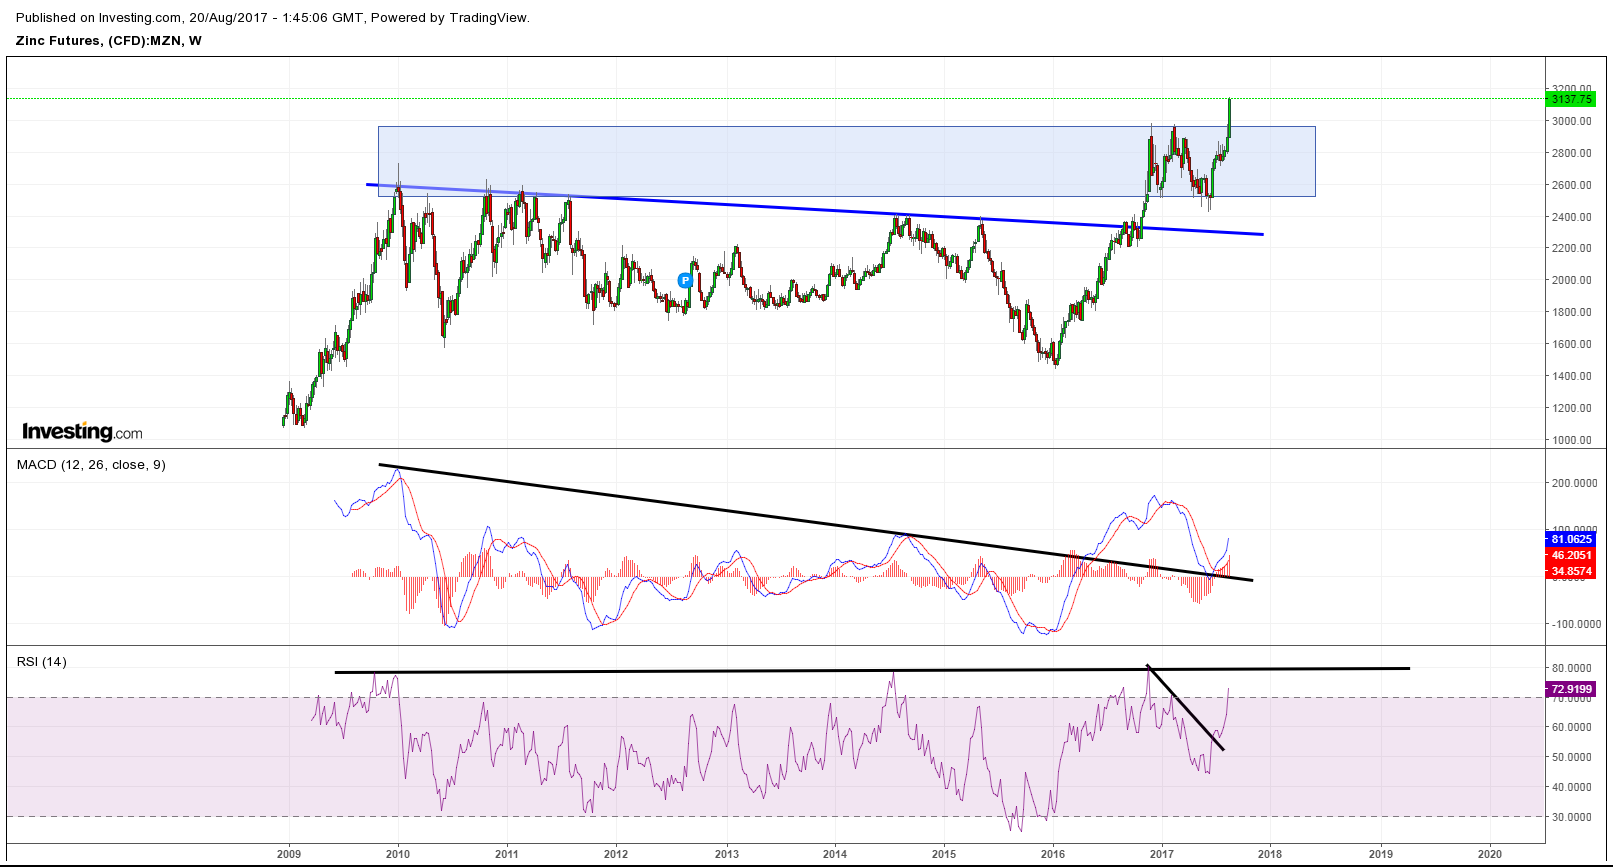
Zinc (Weekly).
Nickel
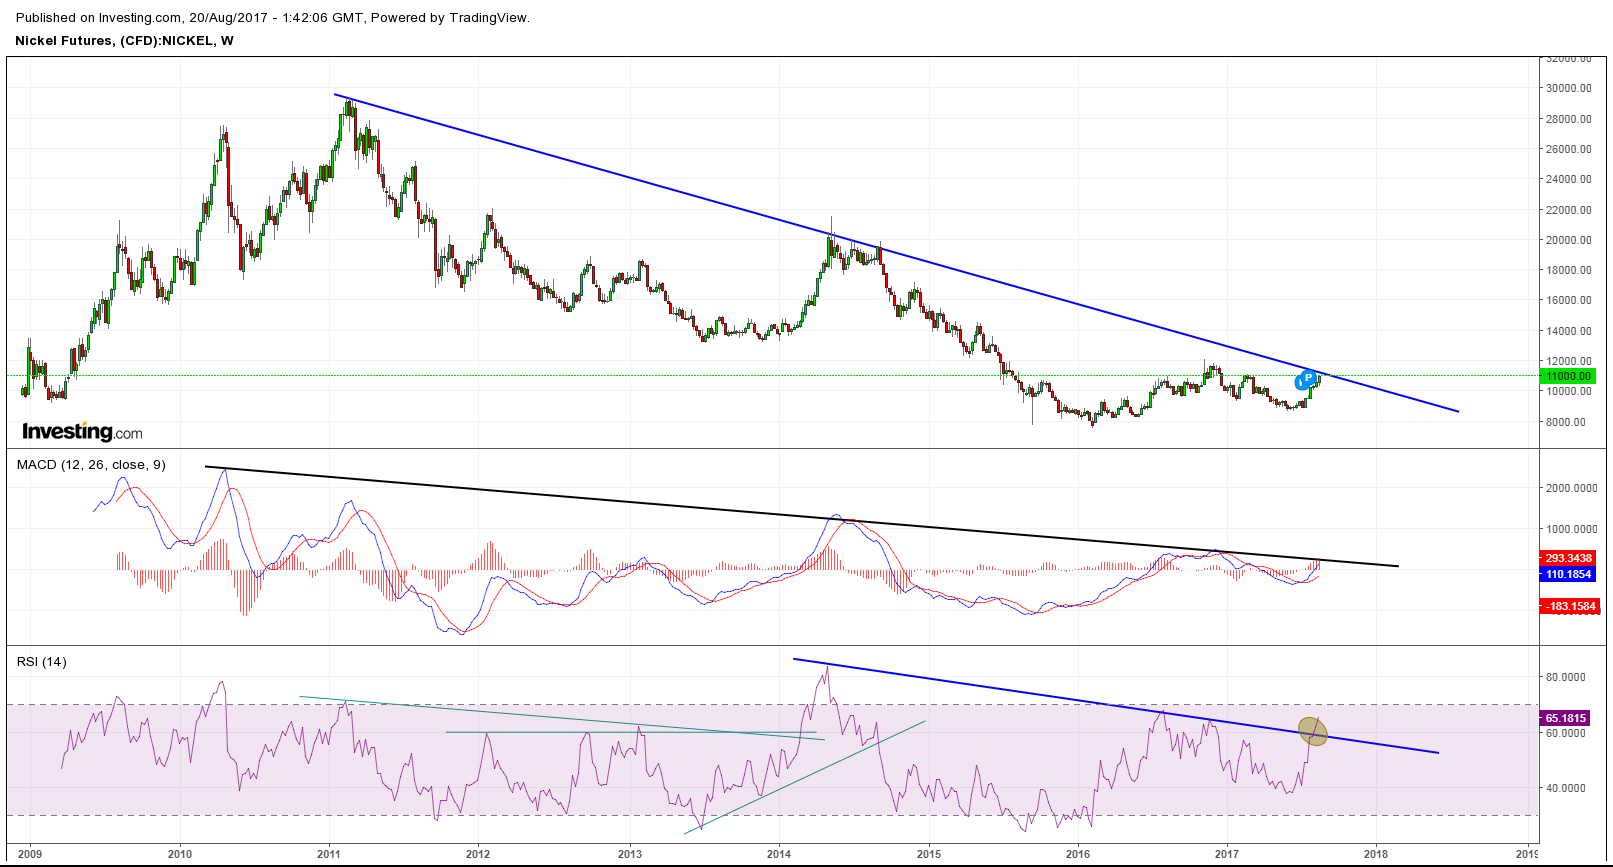
Nickel (Weekly).
Out of these three, nickel is the only one that hasn’t made an important break out… Yet.
The point I am trying to make is that the base metals are signalling inflation (higher input costs), which is making the case for at least a deflationary crash in gold that much weaker. During the last decade, gold and for example copper has been more or less trading in tandem… And if copper and the base metals are in the beginning stages of a multi year bull run, recent history tells us that gold will be along for the ride:
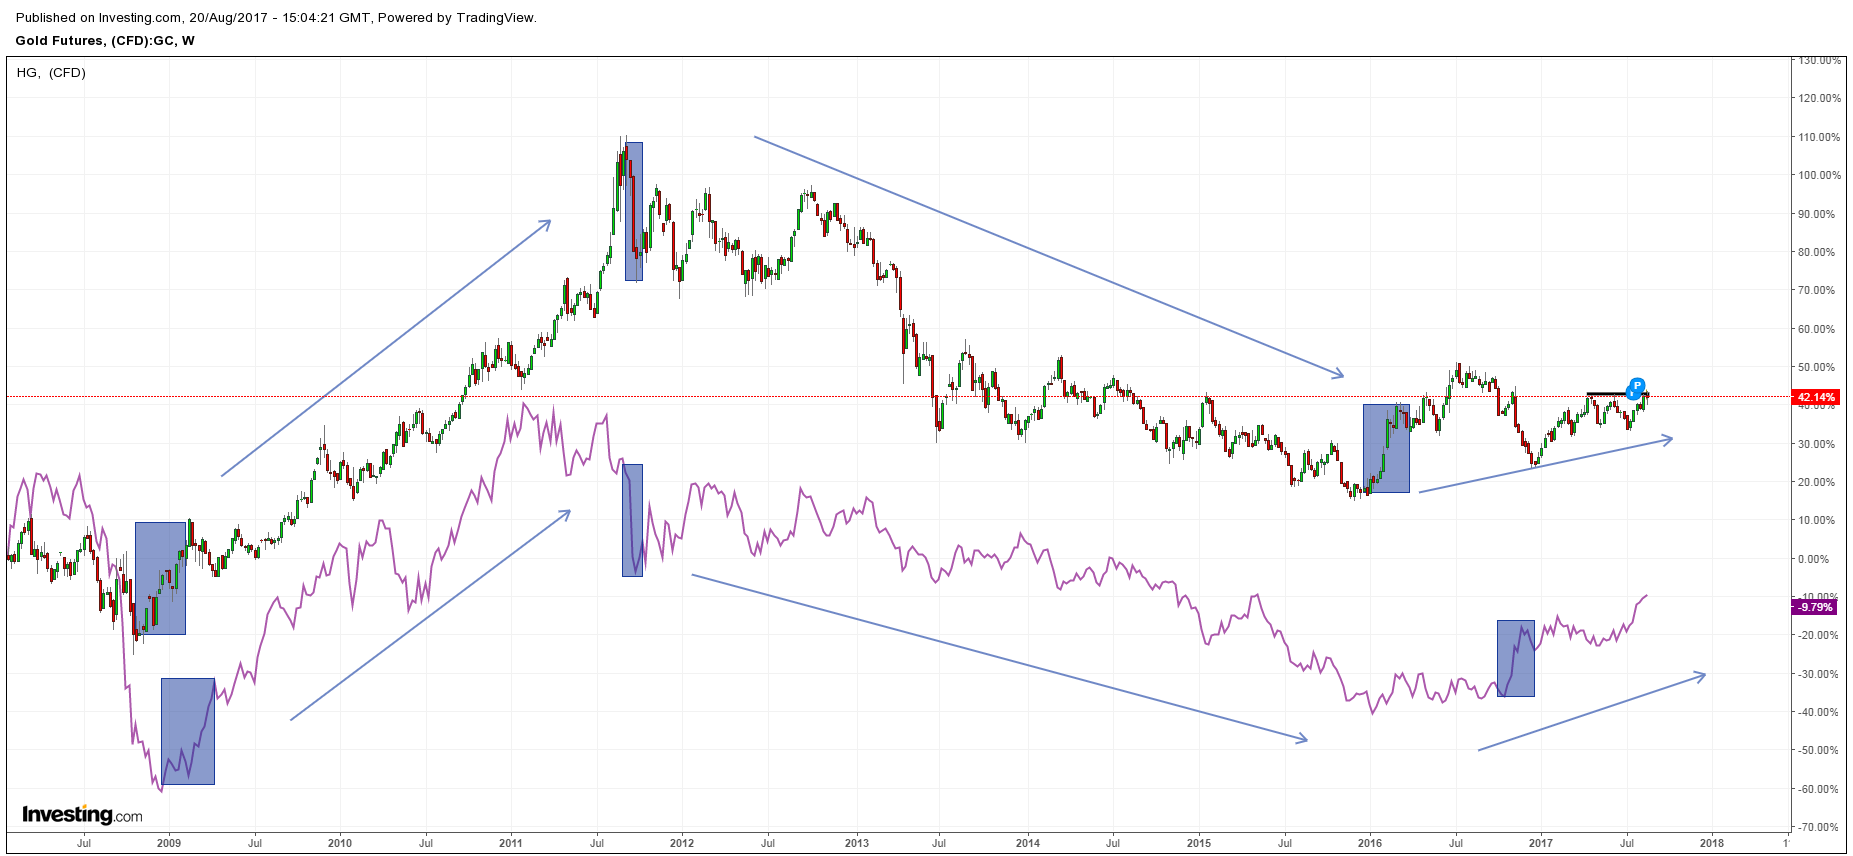
Gold (candlsticks) vs Copper (purple line).
So my thinking is that either we have absolutely HUGE false break outs in the base metals that will lead to a severe reversal that will drag down all metals, or the bull market in base metals is just getting started and will take gold and silver along for the ride. I am personally leaning towards the latter, being a gold bull and all. If my “guess” is correct, this potential correction in gold should be quite shallow, before reversing higher and finally taking out that $1300 resistance zone.


Good charts, looks like we will be heading towards the longest economic expansion in history. With rates near zero, its very possible everything continues as it has been….and the commodities and gold both get bid up, whilst the stock markets grinds sideways to higher. I was watching a 4 part series on ETF’s (and how they truly work) on real vision, and when a trend is in place (which has nothing to do with fundamentals), and there is momentum where deteriorating blue chips continue to get bid up….the party can only end when there are no more buyers left, with entities like the swiss central bank on automation adding via algorithms more money to US bluechips….one has to ask at what point does it end….what happens if all central banks start doing the same, it can go on for a long time so its impossible to forecast the market is a casino, but I guess that can only push commodities higher eventually as oppose to lower so perhaps consider it a blessing 🙂