


Novo: Canadians = Contrarian Indicator?
After playing around a bit with Google Trends in order to find a potential contrarian indicator I stumbled upon the chart for Canada and in hind sight it seems to have been pretty accurate in “predicting” major tops and bottoms…
- Canadian search count for “Novo Resources”:
(Obs! “The January bottom” should be the “April bottom”)
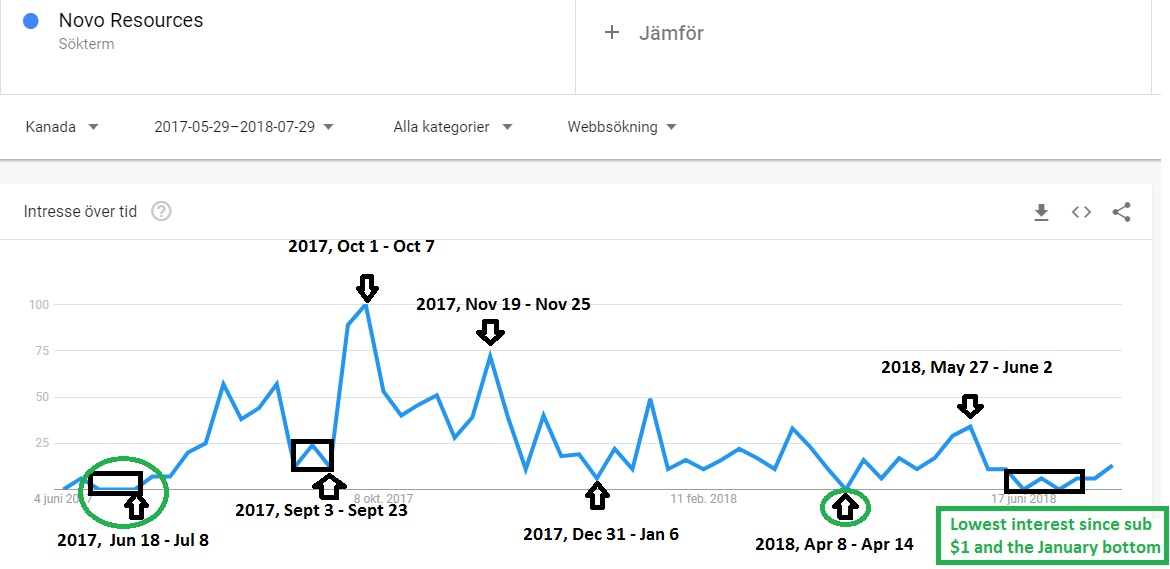
Canada search count (Weekly).
- Novo Resources chart with approximate search tops/bottoms dates:
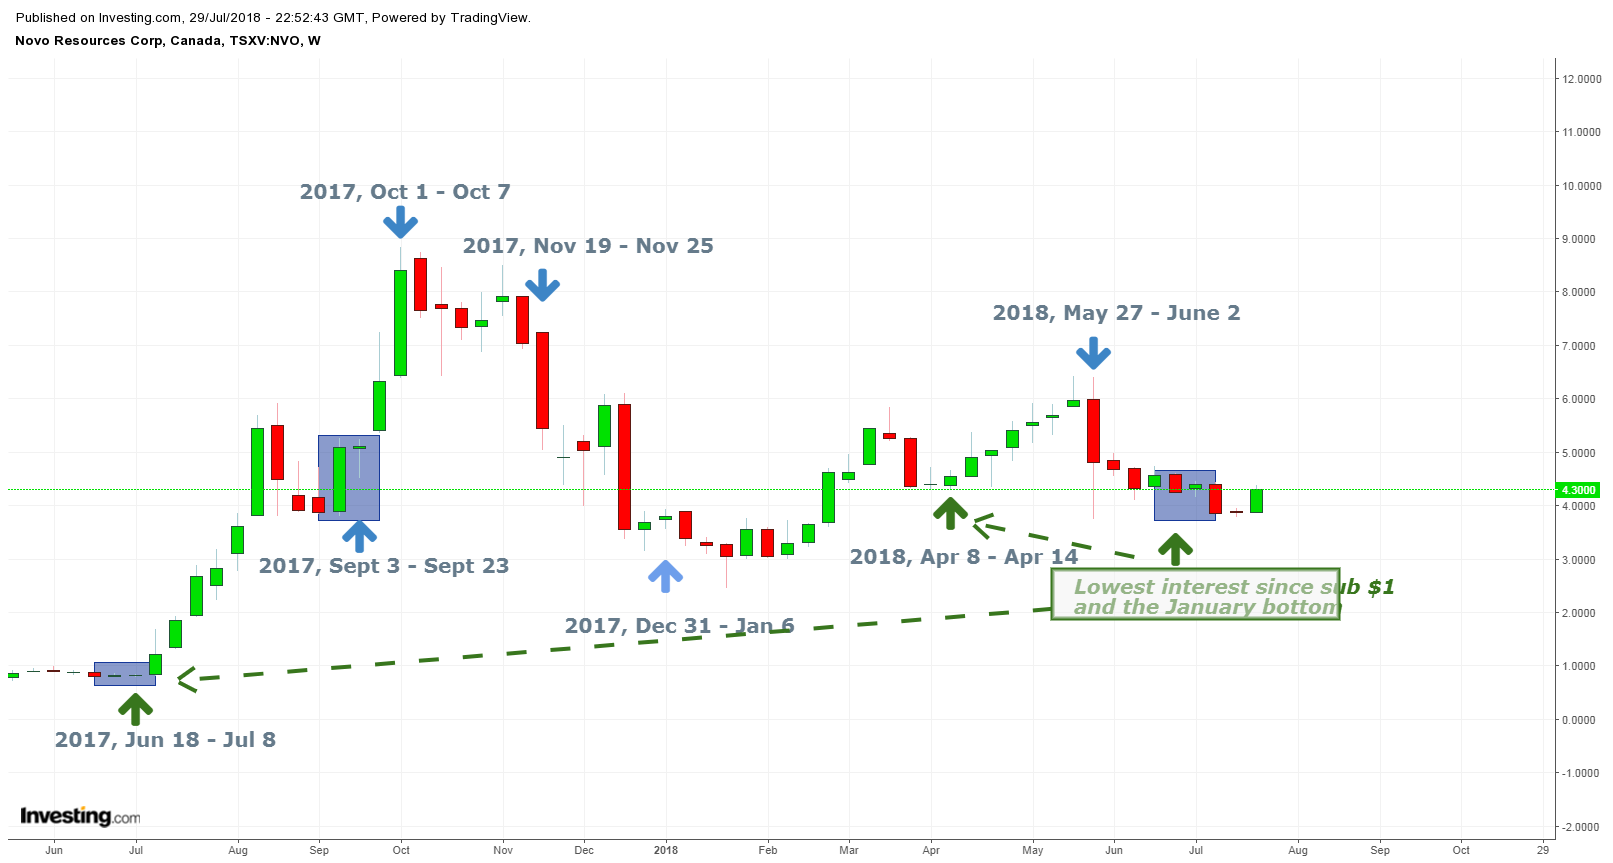
Novo chart (Weekly).
… The last time we saw a reading of zero was during the April 8-14 time period, which preceded a 50% rise within a month and a half. Before that we saw a reading of zero during the period June 18 – July 8, which preceded the big run up from approximately $0.80 to $8.80 within a period of three months. Now, there is no way of knowing if we are in for a 50%-%1000+ rise in the coming weeks or months, but I am even more confident that my bottom call two weeks ago has merit because the sentiment was getting ridiculous (No positive reaction to several positive NRs).
What is interesting is that in my (amateur!) TA eyes it looks like the chart has been forming a major bullish continuation pattern (symmetrical triangle), and that rhymes perfectly with my well known major bullishness in regards to Novo’s fundamentals:
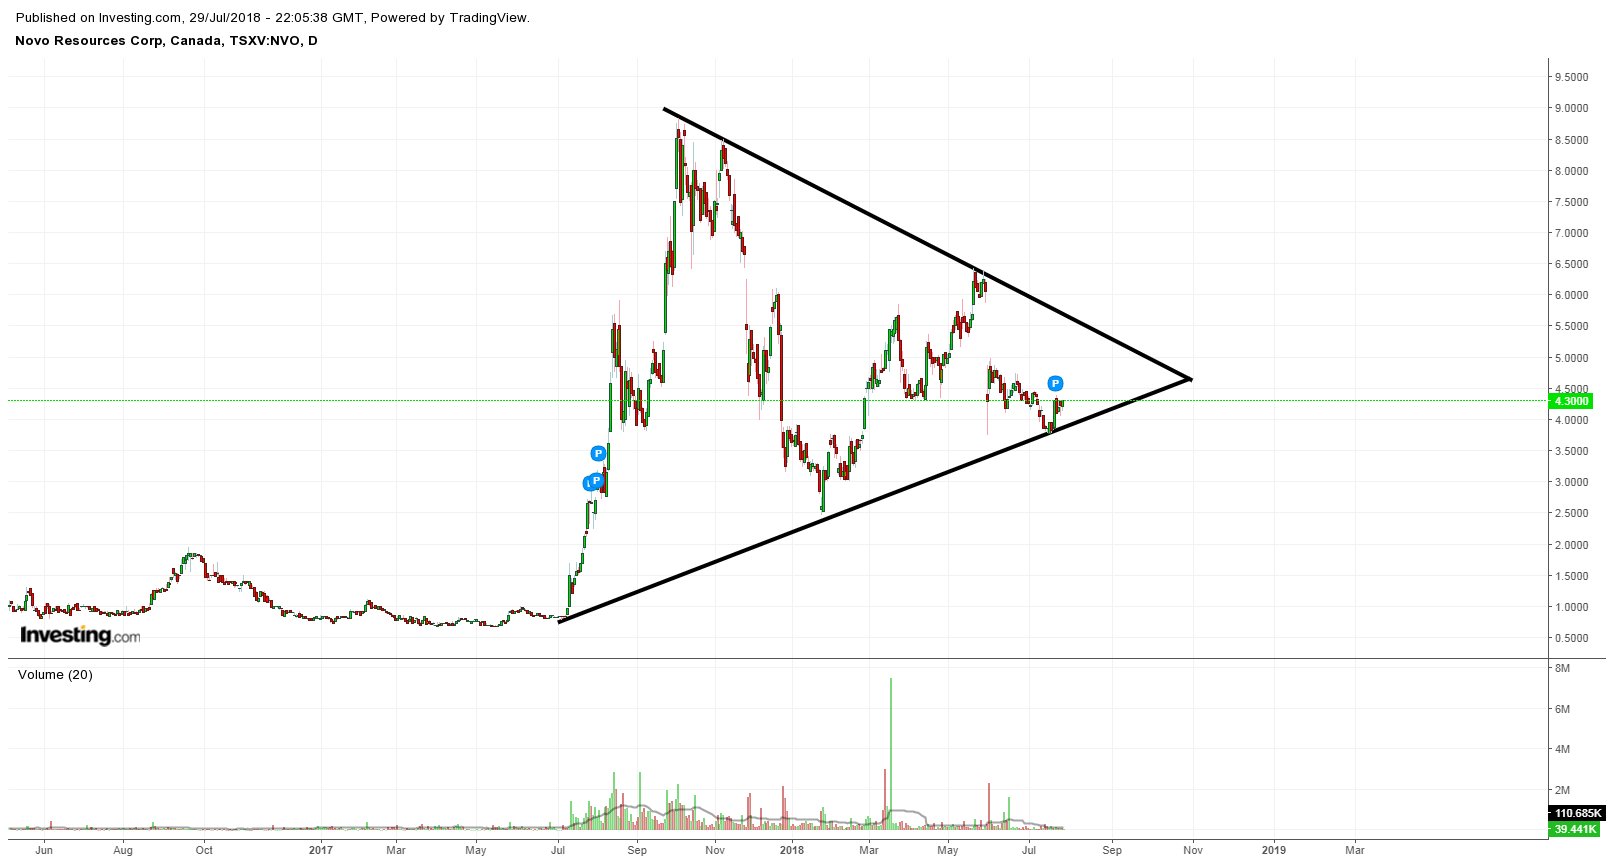
Novo chart (Daily, nominal) – Two lower highs and two higher lows fulfilled on the nominal chart.
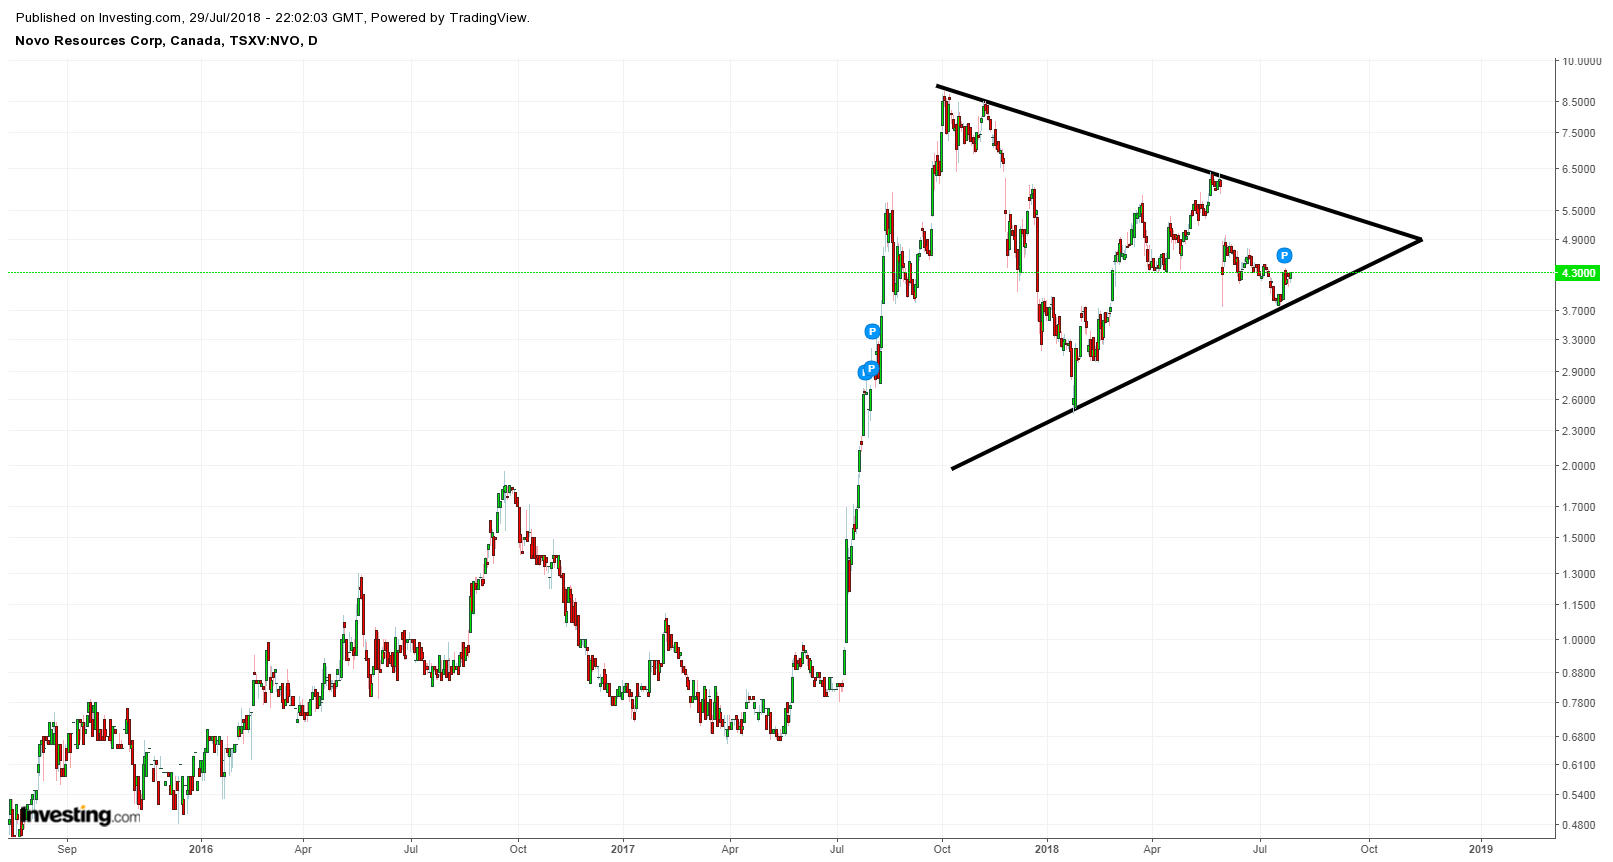
Novo chart (Daily, Log)
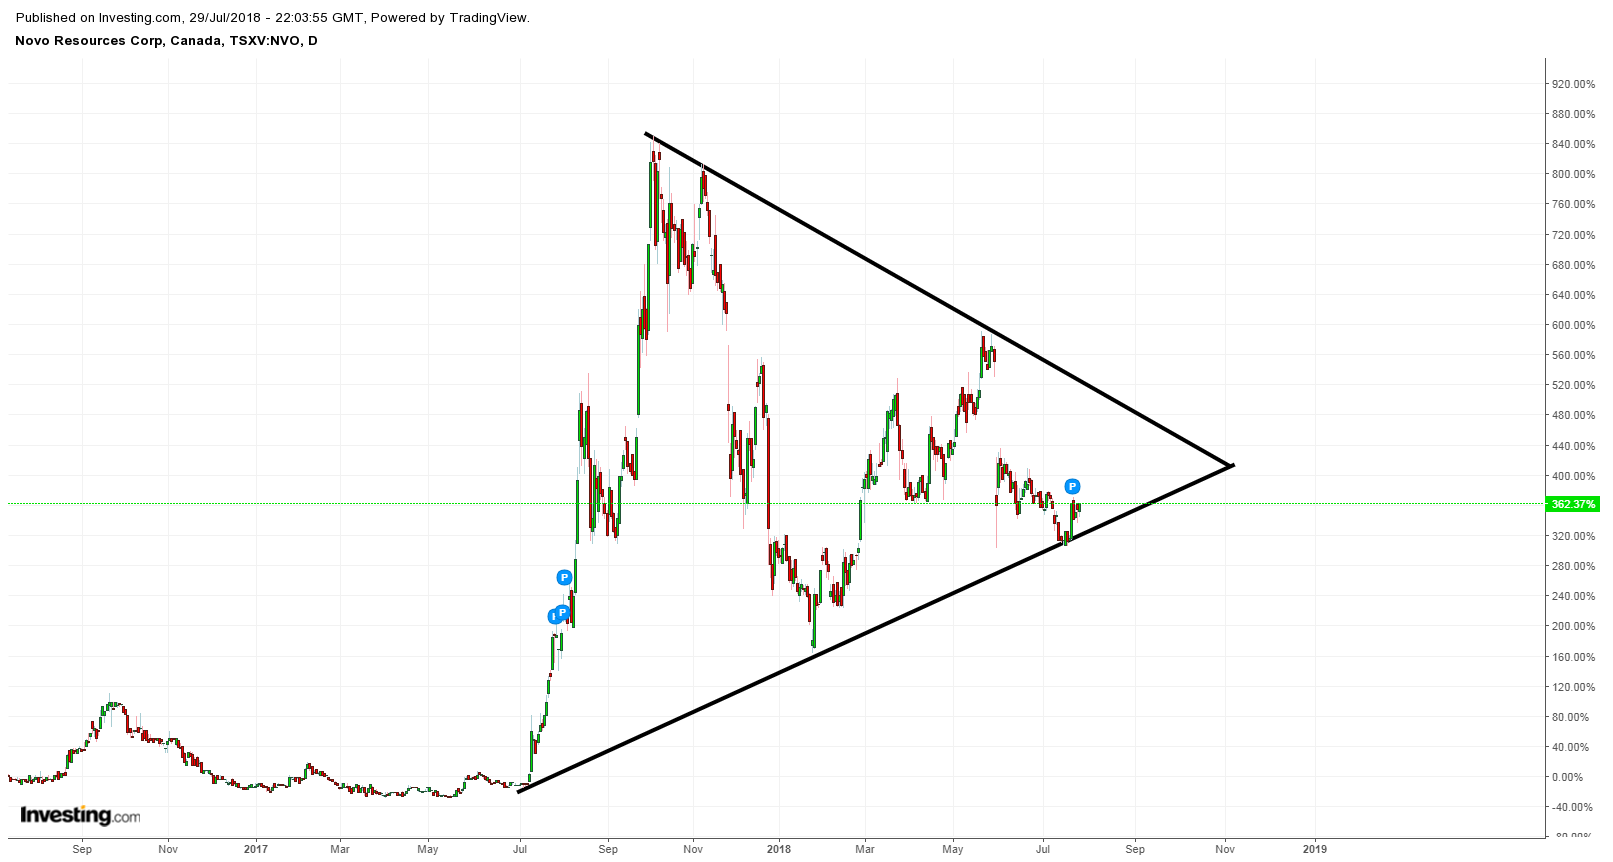
Redundant Novo chart (Daily, Percentage)
… I may have bad eye sight, but to me it looks like symmetrical triangles in both the nominal and logarithmic chart(!). So what’s the deal with symmetrical triangles? Well, as far as I can tell it’s pretty bullish according to THIS article:
Snippet 1:
“The symmetrical triangle, which can also be referred to as a coil, usually forms during a trend as a continuation pattern. The pattern contains at least two lower highs and two higher lows. When these points are connected, the lines converge as they are extended and the symmetrical triangle takes shape. You could also think of it as a contracting wedge, wide at the beginning and narrowing over time.”
Snippet 2:
“In Technical Analysis of Stock Trends (1948), Edwards and Magee suggest that roughly 75% of symmetrical triangles are continuation patterns and the rest mark reversals.”
Snippet 3:
“Price Target: There are two methods to estimate the extent of the move after the breakout. First, the widest distance of the symmetrical triangle can be measured and applied to the breakout point. Second, a trend line can be drawn parallel to the pattern’s trend line that slopes (up or down) in the direction of the break. The extension of this line will mark a potential breakout target.”
With the above in mind, lets get back to the chart:
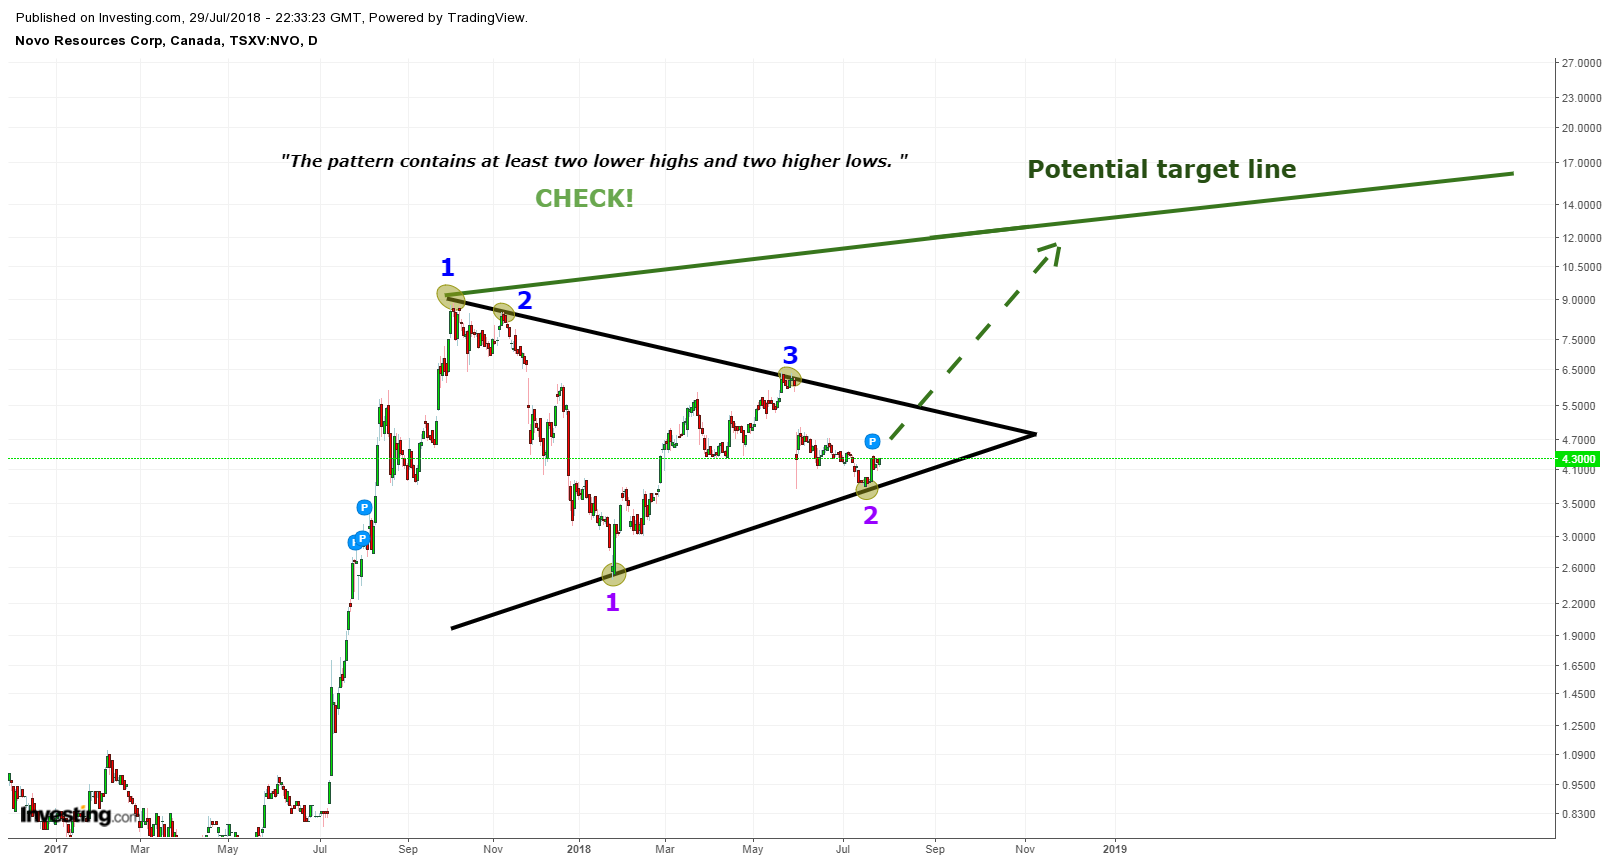
Novo symmetrical triangle target (Daily, log).
- Trend is up (thus a bullish continuation pattern).
- At least two lower highs and two higher lows.
- Correction: Expecting an additional higher low (to fulfill the articles requirements on the log chart).
Final Thoughts
First of all I believe that we have just seen a major bottom based on a number of factors; Expectation of coming news flow, sentiment and most importantly my personal view that Q3 will contain a lot of positive news for us.
I think it’s noteworthy that the highest peak in terms of Google searches for “Novo Resources” correlated with the point in time that produced the (so far) highest peak in Novo. Furthermore, when search interest was at extreme lows (zero) which we have seen recently, Novo tended to produce substantial gains in a short period of time afterwards.
The charts were mostly included for entertainment purposes since I’m 1) Not trading Novo, 2) I’m not a TA expert and 3) I’m bullish based on my DD and fundamentals, not what a chart might be suggesting. This post should NOT be seen as trading or investment advice. I am extremely bullish on and heavily invested in Novo and am thus biased. Thus I am merely presenting my personal thoughts and views.
Best regards,
The Hedgeless Horseman
Follow me on twitter: https://twitter.com/Comm_Invest
Follow me on CEO.ca: https://ceo.ca/@hhorseman
Don’t forget to sign up for my Newsletter (top right on front page) in order to get notification when a new post is up!
If you want to learn more about Novo Resources and the Pilbara Gold Rush you can purchase all my premium content HERE.
If you find my work valuable and want to help me keep publishing most of my research for free then please consider making a donation.